

Refer to Assignment Problem 22. In the same study, Zahran et al. (2010) also measured the lead
Question:
Refer to Assignment Problem 22. In the same study, Zahran et al. (2010) also measured the lead concentration of blood (in μg/dl) of children living in the 46 areas both before and after the hurricanes. The ratio of blood lead concentration after the hurricanes to that before the hurricanes is given below. This ratio has an approximately normal distribution. A ratio of 1.0 indicates no change.
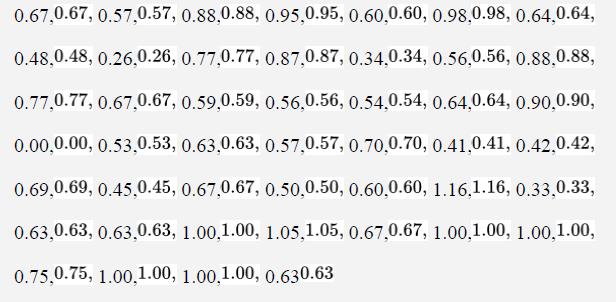
n=46, ΣY=31.14, ΣY2=23.5806
a. Determine the 95% confidence interval for the mean change in blood lead ratio. Describe in words the nature of that change. Is a ratio greater than 1.0 consistent with the data? Is a decrease in blood lead consistent?
b. Is this ratio significantly different from 1.0? Show the appropriate hypothesis test.
Data from problem 22
Hurricanes Katrina and Rita caused the flooding of large parts of New Orleans, leaving behind large amounts of new sediment. Before the hurricanes, the soils in New Orleans were known to have high concentrations of lead, which is a dangerous environmental toxin. Fortysix sites had been monitored before the hurricanes for soil lead content, as measured in mg/kg, and the soil from each of these sites was measured again after the hurricanes (Zahran et al. 2010). The data given below show the log of the ratio of the soil lead content after the hurricanes and the soil lead content before the hurricanes—we’ll call this variable the “change in soil lead.” (Therefore, numbers less than zero show a reduction in soil lead content after the hurricanes, and numbers greater than zero show increases.) This log ratio has an approximately normal distribution.
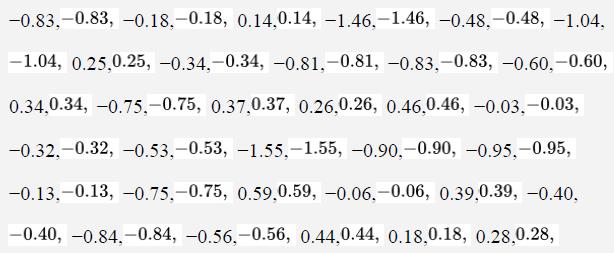
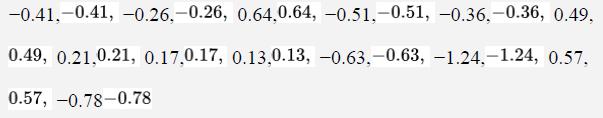
n=46, ΣY=−12.62, ΣY2=18.4606.
Step by Step Answer:
The 95 confidence interval for the mean change in blood lead ratio is approximately 0609 0745 This ...View the full answer


The Analysis Of Biological Data
ISBN: 9781319226237
3rd Edition
Authors: Michael C. Whitlock, Dolph Schluter
