

Spot the flaw. Examine the following figure, which displays the frequency distribution of similarity values (the percentage
Question:
Spot the flaw. Examine the following figure, which displays the frequency distribution of similarity values (the percentage of amino acids that are the same) between equivalent (homologous) proteins in humans and pufferfish of the genus Fugu (data from Aparicio et al. 2002).
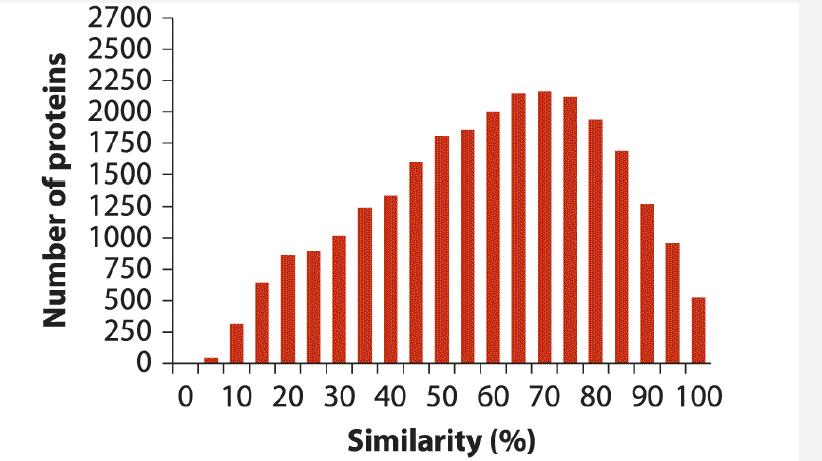
a. What type of graph is this?
b. Identify the main flaw in the construction of this figure.
c. What are the main results displayed in the figure?
d. Describe the shape of the frequency distribution shown.
e. What is the mode in the frequency distribution?
Fantastic news! We've Found the answer you've been seeking!
Step by Step Answer:
a The graph you presented is a histogram A histogram is a type of bar chart that represents the dist...View the full answer

Answered By
Benard Ndini Mwendwa
I am a graduate from Kenya. I managed to score one of the highest levels in my BS. I have experience in academic writing since I have been working as a freelancer in most of my time. I am willing to help other students attain better grades in their academic portfolio. Thank you.
107+ Reviews
240+ Question Solved
Related Book For 

The Analysis Of Biological Data
ISBN: 9781319226237
3rd Edition
Authors: Michael C. Whitlock, Dolph Schluter
Question Posted:
