

The following table lists the mean and standard deviation of several different normal distributions. In each case,
Question:
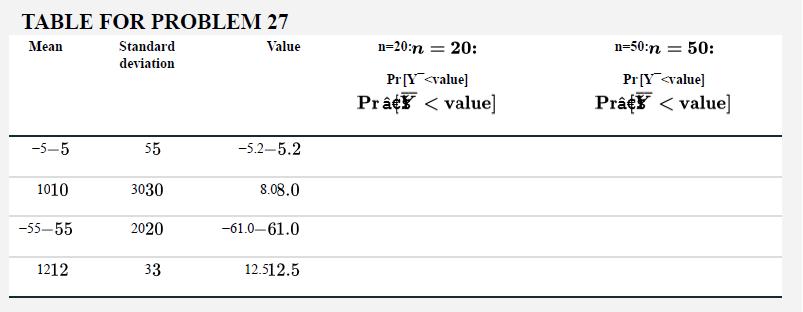
The following table lists the mean and standard deviation of several different normal distributions. In each case, a sample of 20 individuals was taken, as well as a sample of 50 individuals. For each sample, calculate the probability that the mean of the sample was less than the given value.
Fantastic news! We've Found the answer you've been seeking!
Step by Step Answer:
To calculate the probability that the mean of the sample is less than a given value for a normally distributed population you can use the zscore formu...View the full answer

Answered By
Ritik Agarwal
I have taught many students in my school and have gained hands-on experience in resolving doubts of any type to the best of my ability.
0 Reviews
10+ Question Solved
Related Book For 

The Analysis Of Biological Data
ISBN: 9781319226237
3rd Edition
Authors: Michael C. Whitlock, Dolph Schluter
Question Posted:
