

The graph below shows the distribution of age at death for males from Australia. a. What kind
Question:
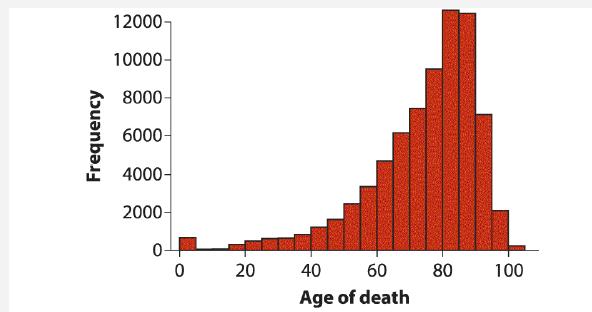
The graph below shows the distribution of age at death for males from Australia.
a. What kind of graph is this?
b. Describe the shape of the distribution. Is it symmetric or skewed? If it is skewed, describe the type of skew.
c. Is this distribution bimodal? Where are the mode or modes?
Fantastic news! We've Found the answer you've been seeking!
Step by Step Answer:
a What kind of graph is this The graph you sent is a histogramHistograms are ...View the full answer

Answered By
Susan Juma
I'm available and reachable 24/7. I have high experience in helping students with their assignments, proposals, and dissertations. Most importantly, I'm a professional accountant and I can handle all kinds of accounting and finance problems.
15+ Reviews
45+ Question Solved
Related Book For 

The Analysis Of Biological Data
ISBN: 9781319226237
3rd Edition
Authors: Michael C. Whitlock, Dolph Schluter
Question Posted:
