

The study of the spatial distribution of vegetation often makes use of random samples of quadrats, rectangular
Question:
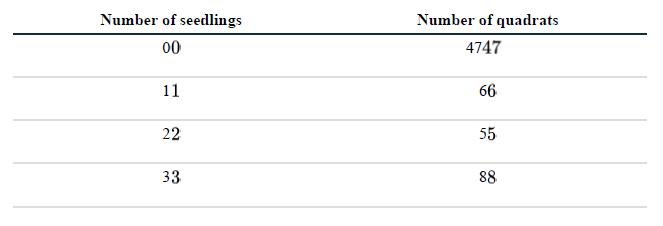
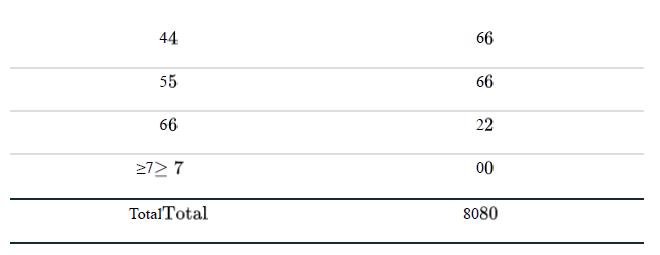
The study of the spatial distribution of vegetation often makes use of random samples of “quadrats,” rectangular plots of fixed size placed at random over the sampling region (e.g., a field or forest). The number of plants of each type occurring within each quadrat is then counted. In one such study, an investigator counted the number of white pine seedlings growing in eighty 10 m×10 m quadrats to test whether the distribution of pine seedlings in the forest was random, clumped, or dispersed. She obtained the following counts:
a. If the null hypothesis of a random distribution of pine seedlings across the forest is correct, to what theoretical probability distribution should the observed frequencies of quadrats containing a given number of seedlings conform?
b. Carry out a formal test of the null hypothesis.
c. If the null hypothesis is rejected in part (b), determine whether the spatial distribution of seedlings is clumped or dispersed.
Step by Step Answer:
a If pine seedlings are distributed randomly the frequencies should fit the Poisson ...View the full answer


The Analysis Of Biological Data
ISBN: 9781319226237
3rd Edition
Authors: Michael C. Whitlock, Dolph Schluter
