

Consider a diagram like Figure 22.3 where states are offered the opportunity to buy into Medicaid under
Question:
Consider a diagram like Figure 22.3 where states are offered the opportunity to buy into Medicaid under the ACA for a 9:1 match.
(a) Mark an initial level of expenditures if the state is spending $20 on Medicaid expenditures and $80 on everything else, with an appropriate indifference curve.
(b) Suppose the state decides to collect a tax of $3, from the initial point, to put up for the match. How big will the match be? Draw the tax and the match on the graph.
(c) In this example is the state likely to be better off or worse off by collecting the tax to get the match? Why or why not?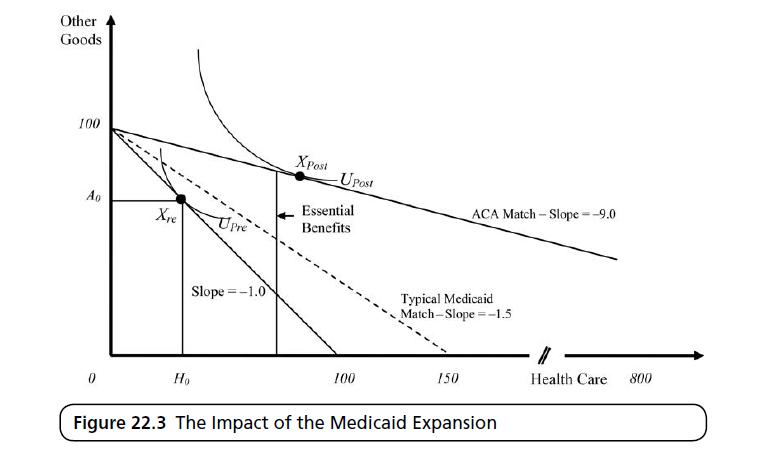
Fantastic news! We've Found the answer you've been seeking!
Step by Step Answer:
Since I cannot actually draw on the image provided to you I will explain how you would go about answering this question and marking the diagram a The ...View the full answer

Answered By
Shameen Tahir
The following are details of my Areas of Effectiveness. The following are details of my Areas of Effectiveness English Language Proficiency, Organization Behavior , consumer Behavior and Marketing, Communication, Applied Statistics, Research Methods , Cognitive & Affective Processes, Cognitive & Affective Processes, Data Analysis in Research, Human Resources Management ,Research Project,
Social Psychology, Personality Psychology, Introduction to Applied Areas of Psychology,
Behavioral Neurosdence , Historical and Contemporary Issues in Psychology, Measurement in Psychology, experimental Psychology,
Business Ethics Business Ethics An introduction to business studies Organization & Management Legal Environment of Business Information Systems in Organizations Operations Management Global Business Policies Industrial Organization Business Strategy Information Management and Technology Company Structure and Organizational Management Accounting & Auditing Financial Accounting Managerial Accounting Accounting for strategy implementation Financial accounting Introduction to bookkeeping and accounting Marketing Marketing Management Professional Development Strategies Business Communications Business planning Commerce & Technology Human resource management General Management Conflict management Leadership Organizational Leadership Supply Chain Management Law Corporate Strategy Creative Writing Analytical Reading & Writing Other Expertise Risk Management Entrepreneurship Management science Organizational behavior Project management Financial Analysis, Research & Companies Valuation And any kind of Excel Queries.
16+ Reviews
34+ Question Solved
Related Book For 

The Economics Of Health And Health Care
ISBN: 9781138208049
8th Edition
Authors: Sherman Folland, Allen C. Goodman, Miron Stano
Question Posted:
