

Figure 6.5, panel A, illustrates technical inefficiency for firms with a one-input production function. It was explained
Question:
Figure 6.5, panel A, illustrates technical inefficiency for firms with a one-input production function. It was explained that ineffi ciency could be measured by output distance or, alternatively, input reduction distance. Sketch and explain the comparable measures for the two-input production function.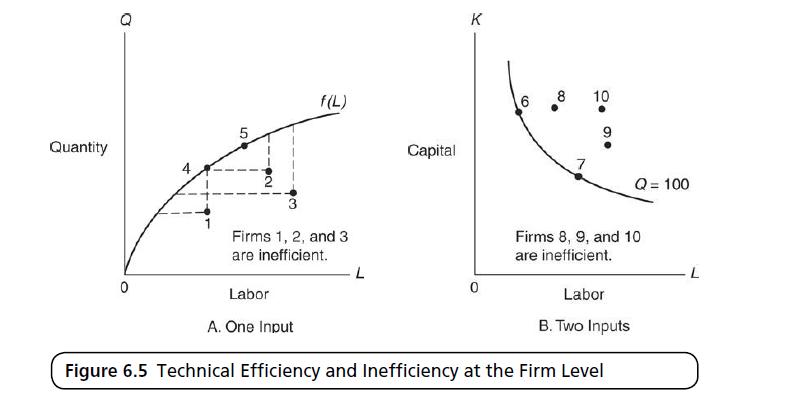
Fantastic news! We've Found the answer you've been seeking!
Step by Step Answer:
The image illustrates technical efficiency and inefficiency at the firm level for two different cases one with a singleinput production function panel ...View the full answer

Answered By
GERALD KAMAU
non-plagiarism work, timely work and A++ work
6+ Reviews
11+ Question Solved
Related Book For 

The Economics Of Health And Health Care
ISBN: 9781138208049
8th Edition
Authors: Sherman Folland, Allen C. Goodman, Miron Stano
Question Posted:
