

On the accompanying graph, illustrate for each year (A) the nominal interest rate (use the prime rate
Question:
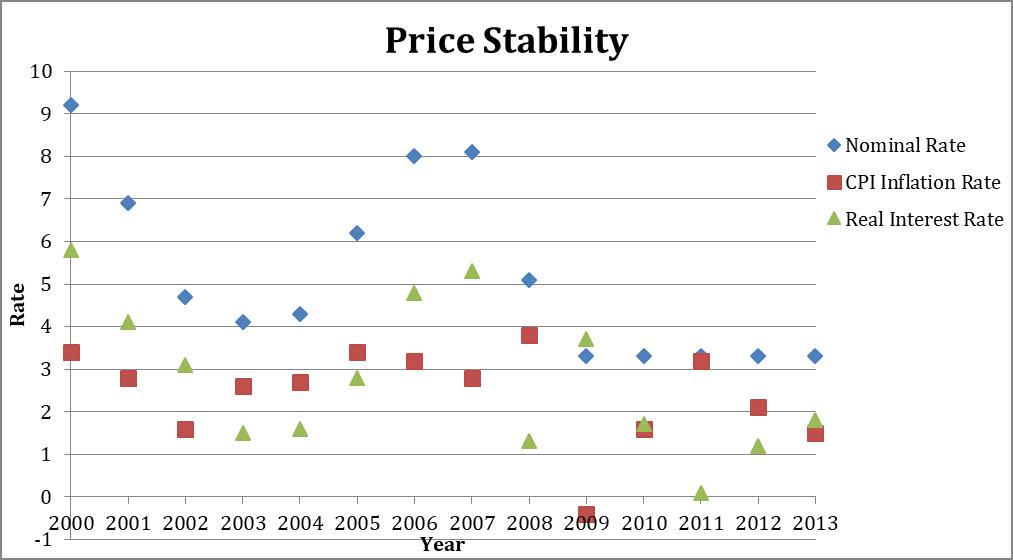
On the accompanying graph, illustrate for each year (A) the nominal interest rate (use the prime rate of interest), (B) the CPI inflation rate, and (C) the real interest rate (adjusted for same-year CPI inflation). The required data appear on the inside cover of this book.
(a) In what years was the official goal of price stability met?
(b) In what years was the inflation rate lowest?
(c) In the most recent of those years, what was the
(i) Nominal interest rate?
(ii) Real interest rate?
(d) What was the range of rates during this period for
(i) Nominal interest rates?
(ii) Real interest rates?
(e) On a year-to-year basis, which varies more—nominal or real interest rates?
Step by Step Answer:

This question has not been answered yet.
You can Ask your question!


The Macro Economy Today
ISBN: 978-1259291821
14th edition
Authors: Bradley R. Schiller, Karen Gebhardt
