

Question: Use the following information to draw aggregate demand (AD) and aggregate supply (AS) curves on the following graph. Both curves are assumed to be straight
(a) At what rate of real output does equilibrium occur?
(b) What curve (AD or AS) would have shifted if a new equilibrium were to occur at an output level of 600 and a price level of $600?
(c) What curve would have shifted if a new equilibrium were to occur at an output level of 600 and price level of $200?
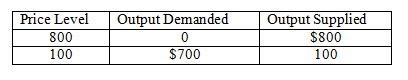
Price Level 800 100 Output Demanded Output Supplied $800 $700 100
Step by Step Solution
3.49 Rating (179 Votes )
There are 3 Steps involved in it
a 400 b AD c AS Feedback a As depicted by the graph the AD and AS curves cross at a real out... View full answer

Get step-by-step solutions from verified subject matter experts
Document Format (2 attachments)
1459_6054778c5803e_657577.pdf
180 KBs PDF File
1459_6054778c5803e_657577.docx
120 KBs Word File