

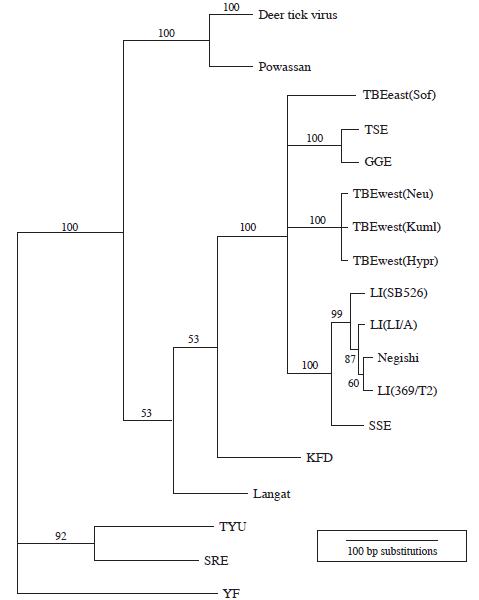
In Figure 1, the values above branches indicate bootstrapped confidence values. Branch lengths are proportional to percent
Question:
In Figure 1, the values above branches indicate bootstrapped confidence values. Branch lengths are proportional to percent similarity in viral envelope gene sequence. TBE: tick borne encephalitis; TSE: Turkish sheep encephalitis; GGE: Greek goat encephalitis; LI: louping ill virus; SSE: Spanish sheep encephalitis; KFD: Kyasanur Forest disease virus; TYU: Tyuleniy virus; SRE: Saumarez Reef virus.
(a) Describe what is represented by a node in a phylogenetic tree.
(b) Identify two of the viruses that are LEAST similar to GGE.
(c) In 50 years, new data have identified that TBEwest(Hypr) is no longer in circulation, but it seems to have evolved in two directions: TBEwest1 and TBEwest2.
Using the empty tree below, correctly indicate TBEwest(neu), TBEwest(Kuml), TBEwest1, and TBEwest2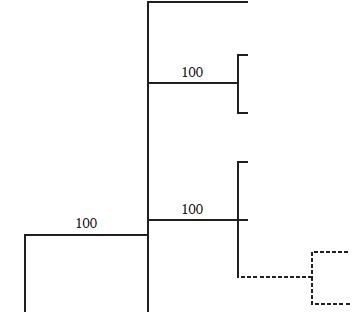
(d) This phylogenetic tree was created using nucleotide sequences. If protein sequences were used instead, explain why this might increase the similarity between the viruses?
Step by Step Answer:
a A node represents a common ancestor This means that the species that branch from that p...View the full answer


The Princeton Review AP Biology Premium Prep 2023
ISBN: 9780593450659
2023 Edition
Authors: The Princeton Review
