

The data in the figure above would best support which conclusion? (A) If you decreased the number
Question:
The data in the figure above would best support which conclusion?
(A) If you decreased the number of females, the container would have to remain constant.
(B) The number of offspring produced scales proportionally with the container's size.
(C) The number of offspring produced increases with time.
(D) Daphnia prefer high-density conditions to have the most efficient reproductive rate.
A group of Daphnia, small crustaceans known as water fleas, was placed in one of three culture jars of different sizes to determine their reproductive rate. There were 100 females in the jar. The graph below shows the average number of offspring produced per female each day in each jar of pond water.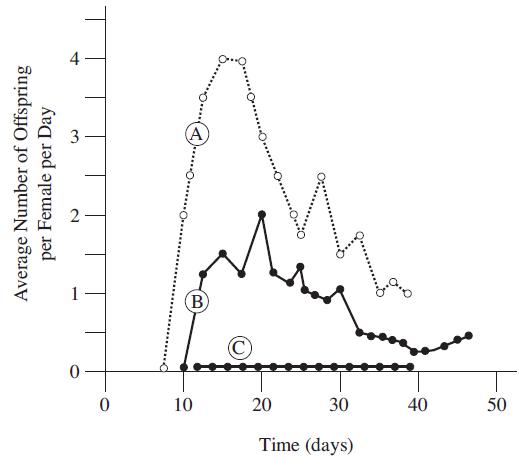
Step by Step Answer:
B The passage does not say that the container would s...View the full answer


The Princeton Review AP Biology Premium Prep 2023
ISBN: 9780593450659
2023 Edition
Authors: The Princeton Review
