

As part of a science project, you study traffic patterns in your city at an intersection in
Question:
As part of a science project, you study traffic patterns in your city at an intersection in the middle of downtown. You set up a device that counts the cars passing through this intersection for a 24-hr period during a weekday. The graph of hourly traffic looks like this.
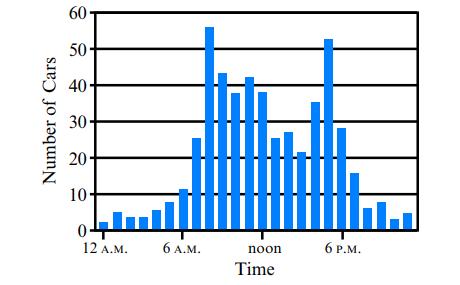
a. At what time(s) does the highest number of cars pass through the intersection?
b. At what time(s) does the lowest number of cars pass through the intersection?
c. Briefly describe the trend in numbers of cars over the course of the day.
d. Provide a hypothesis explaining the trend in numbers of cars over the course of the day.
e. Provide a possible experiment that could test your hypothesis.
Step by Step Answer:
ANSWER a The highest number of cars passing through the intersection occurs at 8 AM and 5 PM b The l...View the full answer


Chemistry
ISBN: 9781305957404
10th Edition
Authors: Steven S. Zumdahl, Susan A. Zumdahl, Donald J. DeCoste
