

A phase diagram is drawn for a mixture of two substances at a fixed pressure p with
Question:
A phase diagram is drawn for a mixture of two substances at a fixed pressure p with a liquid phase and a gaseous phase (Fig. 6.18). The substances are labelled 1 and 2 and the diagram is shown as a function of the concentration c1 of substance 1. There is a range of temperature for which there is coexistence of two phases. Answer the following questions, treating the concentrations cA1and cB1 as given values.a) Apply the Gibbs phase rule (6.62) to find the number of degrees of freedom when two phases coexist at a fixed pressure p.b) We distill a substance 1 with an initial concentration cA1 by heating the liquid up to the temperature TC. Determine the final concentration of substance 1 afterdistillation.c) A mixture with a concentration cC1 of substance 1 is put in a container. The mixture is brought to a temperature TC while the pressure remains at p. Establish that,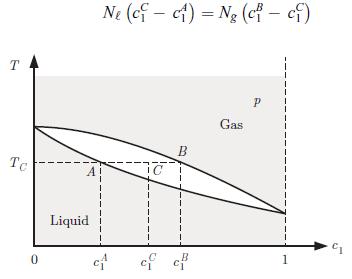
Phase diagram of a binary mixture presenting two phases and an exclusion zone (see § 6.4).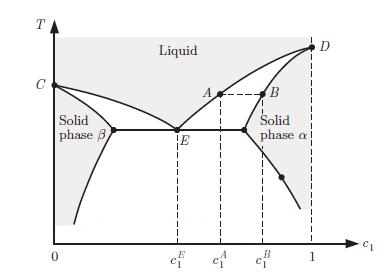 Phase diagram of a binary mixture presenting a eutectic point at E. where N the amount of mixture in the liquid phase, and Ng that in the gas phase. This is known as the lever rule.
Step by Step Answer:


Principles Of Thermodynamics
ISBN: 9781108426091
1st Edition
Authors: Jean-Philippe Ansermet, Sylvain D. Brechet
