

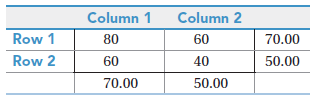
Given the cell means, row means, and column means below, (a) Graph the results to determine if
Question:
(a) Graph the results to determine if there is an interaction;
(b) Speculate about which effects would be statistically significant;
(c) Indicate which effects should be interpreted.
Fantastic news! We've Found the answer you've been seeking!
Step by Step Answer:
a There is no evidence of an interaction b Both ...View the full answer

Answered By
Qurat Ul Ain
Successful writing is about matching great style with top content. As an experienced freelance writer specialising in article writing and ghostwriting, I can provide you with that perfect combination, adapted to suit your needs.
I have written articles on subjects including history, management, and finance. Much of my work is ghost-writing, so I am used to adapting to someone else's preferred style and tone. I have post-graduate qualifications in history, teaching, and social science, as well as a management diploma, and so am well equipped to research and write in these areas.
265+ Reviews
421+ Question Solved
Related Book For 
Question Posted:
