

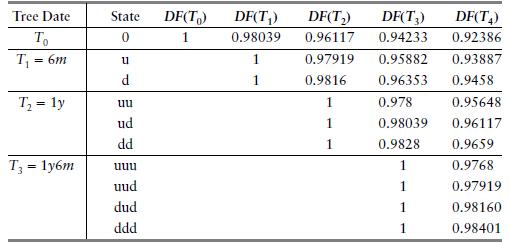
Using the example in Figure 7.7 and the results in Table 7.5 (a) Show the computations for
Question:
Using the example in Figure 7.7 and the results in Table 7.5
(a) Show the computations for the \(T_{1}\) discount factor curves in each of the \((u, d)\) states starting from the \(T_{2}\) discount factor curves.
(b) Show the computation for the Arrow-Debreu prices of the three \(T_{2}\) states \((u u, u
d, d d)\) from the \(T_{1}\) AD prices.
(c) Calculate the semiannual 1-year CMS (par swap) rate in each of the \((u, d)\) states at \(T_{1}\).
(d) Calculate today's value of a \(\$ 1 \mathrm{M}\) European-style 6 month into 1-year payer swaption with semiannual fixed rate of \(4 \%\) per annum.
Figure 7.7
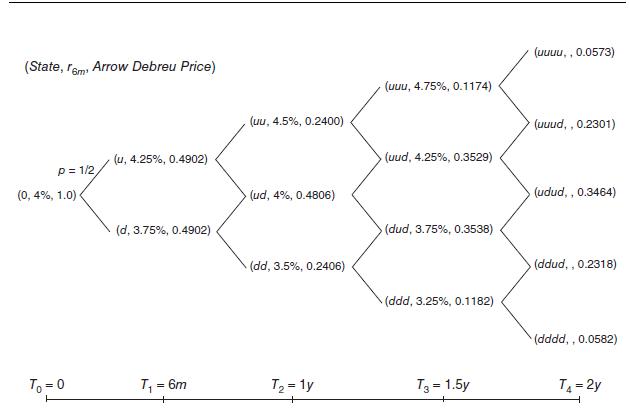
Table 7.5
Fantastic news! We've Found the answer you've been seeking!
Step by Step Answer:

Answered By
Stacy kosgei
I offer quality, original and timely services; Highly credible and void of plagiarism. Your success is my pleasure.
2+ Reviews
10+ Question Solved
Related Book For 

Mathematical Techniques In Finance An Introduction Wiley Finance
ISBN: 9781119838401
1st Edition
Authors: Amir Sadr
Question Posted:
