

Suppose that a researcher does a study to see how level of anxiety (A 1 = low,
Question:
Suppose that a researcher does a study to see how level of anxiety (A1 = low, A2 = medium, A3 = high) is used to predict exam performance (Y). Here are hypothetical data for this research situation. Each column represents scores on Y (exam scores).
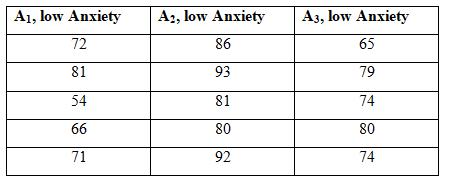
a. Would it be appropriate to do a Pearson correlation (and/or linear regression) between Anxiety, coded 1, 2, 3 for (low, medium, high) and exam score? Why or why not?
b. Set up orthogonal coded dummy variables (O1, O2) to represent linear and quadratic trend, and run a regression analysis to predict exam scores from O1 and O2. What conclusions can you draw about the nature of the relationship between anxiety and exam performance?
c. Set up dummy coded dummy variables to contrast each of the other groups to Group 2, medium Anxiety; run a regression to predict exam performance (Y) from these dummy coded dummy variables.
d. Run a one way ANOVA on these scores; request contrasts between group 2, medium anxiety, and each of the other groups. Do a point-by-point comparison of the numerical results for your ANOVA printout and the numerical results for the regression in part 2c, pointing out where the results are equivalent.
Step by Step Answer:
a It would not be appropriate to report a Pearson correlation between Anxiety and Exam score because these variables are not linearly related Exam sco...View the full answer


Applied Statistics From Bivariate Through Multivariate Techniques
ISBN: 9781412991346
2nd Edition
Authors: Rebecca M. Warner
