

Table 5E.3 presents 20 subgroups of five measurements on the time it takes to service a customer.
Question:
Table 5E.3 presents 20 subgroups of five measurements on the time it takes to service a customer.
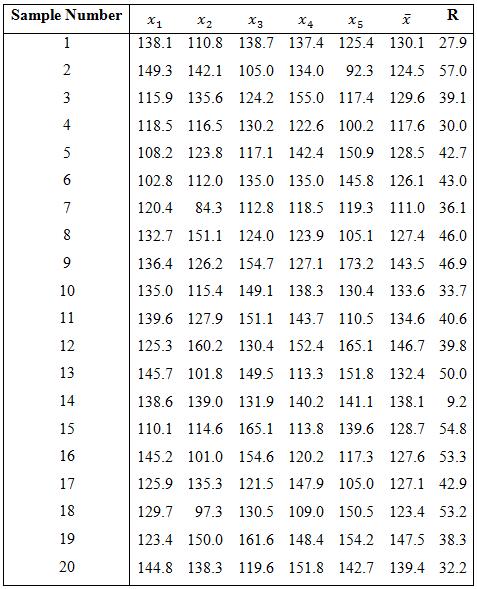
a. Set up ![]() and R control charts for this process and verify that it is in statistical control.
and R control charts for this process and verify that it is in statistical control.
b. Following establishing of the control charts in part (a), 10 new samples have been provided in Table 5E.4. Plot the new and R values using the control chart limits you established in part (a) and draw conclusions.
Fantastic news! We've Found the answer you've been seeking!
Step by Step Answer:
a MTB Stat Control Charts Variables Charts for Subgroups XbarR The process appears to exhibit statis...View the full answer

Answered By
Utsab mitra
I have the expertise to deliver these subjects to college and higher-level students. The services would involve only solving assignments, homework help, and others.
I have experience in delivering these subjects for the last 6 years on a freelancing basis in different companies around the globe. I am CMA certified and CGMA UK. I have professional experience of 18 years in the industry involved in the manufacturing company and IT implementation experience of over 12 years.
I have delivered this help to students effortlessly, which is essential to give the students a good grade in their studies.
2+ Reviews
10+ Question Solved
Related Book For 
Managing Controlling and Improving Quality
ISBN: 978-0471697916
1st edition
Authors: Douglas C. Montgomery, Cheryl L. Jennings, Michele E. Pfund
Question Posted:
