

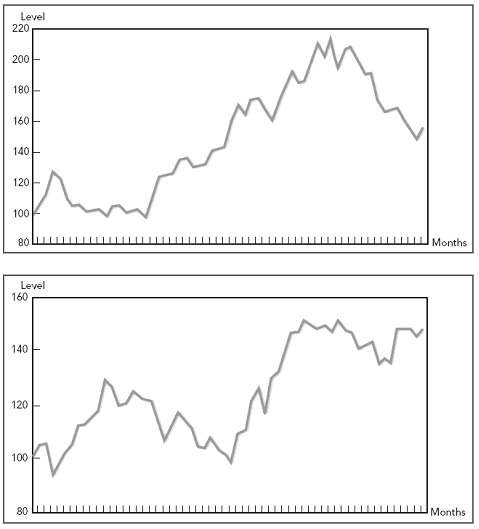
The bottom graph in Figure 13.1 shows the actual performance of the Standard and Poor?s 500 Index
Question:
The bottom graph in Figure 13.1 shows the actual performance of the Standard and Poor?s 500 Index for a five-year period. Two financial managers, Alpha and Beta, are contemplating this chart. Each manager?s company needs to issue new shares of common stock sometime in the next year.
Alpha: My company?s going to issue right away. The stock market cycle has obviously topped out, and the next move is almost surely down. Better to issue now and get a decent price for the shares.
Beta: You?re too nervous; we?re waiting. It?s true that the market?s been going nowhere for the past year or so, but the figure clearly shows a basic upward trend. The market?s on the way up to a new plateau. What would you say to Alpha and Beta?
Common stock is an equity component that represents the worth of stock owned by the shareholders of the company. The common stock represents the par value of the shares outstanding at a balance sheet date. Public companies can trade their stocks on...
Step by Step Answer:
They are both under the illusion that markets are predicta...View the full answer


Principles of Corporate Finance
ISBN: 978-0072869460
7th edition
Authors: Richard A. Brealey, Stewart C. Myers
