The condensed comparative income statements of Ada Corporation appear below. The corporations condensed comparative balance sheets follow.
Question:
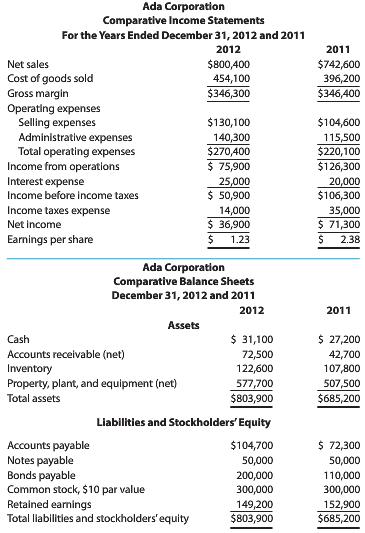
The condensed comparative income statements of Ada Corporation appear below. The corporation’s condensed comparative balance sheets follow. All figures are given in thousands of dollars except earnings per share and market price per share. Additional data for Ada in 2012 and 2011 are as follows:
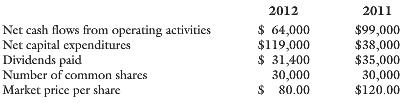
Balances of selected accounts at the end of 2010 were accounts receivable (net), $52,700; inventory, $99,400; accounts payable, $64,800; total assets, $647,800; and stockholders’ equity, $376,600. All of the bonds payable were long-term liabilities.
REQUIRED
Perform the following analyses for 2012 and 2011. (Note: Round percentages and ratios to one decimal place.)
1. Prepare a profitability and total asset management analysis by calculating for each year the
(a) Profit margin,
(b) Asset turnover,
(c) Return on assets.
2. Prepare a liquidity analysis by calculating for each year the
(a) Cash flow yield,
(b) Cash flows to sales,
(c) Cash flows to assets,
(d) Free cash flow.
3. Prepare a financial risk analysis by calculating for each year the
(a) Debt to equity ratio,
(b) Return on equity,
(c) Interest coverage ratio.
4. Prepare an operating asset management analysis by calculating for each year the
(a) Inventory turnover,
(b) Days’ inventory on hand,
(c) Receivable turnover,
(d) Days’ sales uncollected,
(e) Payables turnover,
(f) Days’ payable
(g) Current ratio,
(h) Quick ratio.
5. Prepare a market strength analysis by calculating for each year the
(a) Price/earnings (P/E) ratio
(b) Dividends yield.
Step by Step Answer:
Ratio Name 1 Profitability and total asset management analysis a Profit margin b Asset turnover C Return on assets 36900 800400 46 803900 800400 74455...View the full answer