

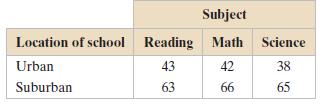
The contingency table shows the results of a random sample of students by the location of school
Question:
The contingency table shows the results of a random sample of students by the location of school and the number of those students achieving basic skill levels in three subjects. At α = 0.01, test the hypothesis that the variables are independent.
Perform the indicated chi-square independence test by doing the following.
(a) Identify the claim and state H0 and Ha.
(b) Determine the degrees of freedom, find the critical value, and identify the rejection region.
(c) Find the chi-square test statistic. If convenient, use technology.
(d) Decide whether to reject or fail to reject the null hypothesis.
(e) Interpret the decision in the context of the original claim.
Fantastic news! We've Found the answer you've been seeking!
Step by Step Answer:
a The claim is achieving a basic skill level is related to the l...View the full answer

Answered By
Utsab mitra
I have the expertise to deliver these subjects to college and higher-level students. The services would involve only solving assignments, homework help, and others.
I have experience in delivering these subjects for the last 6 years on a freelancing basis in different companies around the globe. I am CMA certified and CGMA UK. I have professional experience of 18 years in the industry involved in the manufacturing company and IT implementation experience of over 12 years.
I have delivered this help to students effortlessly, which is essential to give the students a good grade in their studies.
2+ Reviews
10+ Question Solved
Related Book For 

Elementary Statistics Picturing The World
ISBN: 9780321911216
6th Edition
Authors: Ron Larson, Betsy Farber
Question Posted:
