

The data for this exercise were taken from a chemical assay of calcium discussed in Brown, Healy,
Question:
The data in the following table relate to assays on the above pattern of a set of six unknowns performed by four laboratories. The standards are identified as 2.0A, 2.0B, 2.5, 3.0A, and 3.0B; the unknowns are identified as U1, U2, W1, W2, Y1, and Y2.
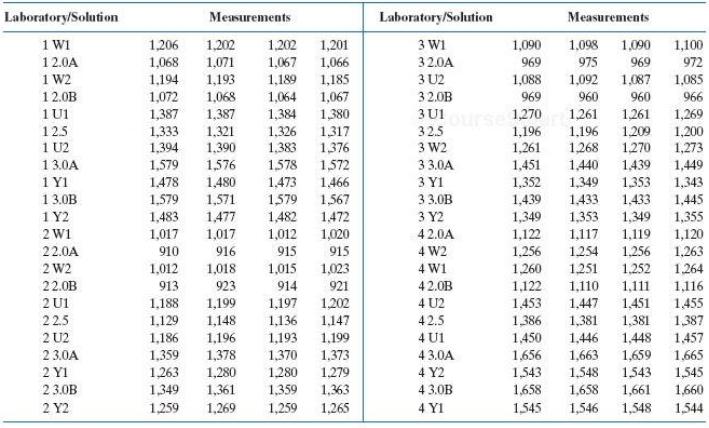
b. Fit the linear regression equation y = β0 + β1x + ɛ for each laboratory, and predict the value of x corresponding to the y for each of the unknowns. Compute the standard deviation of the predicted values of x based on the four predicted x- values for each of the unknowns.
c. Which laboratory appears to make better predictions of x, mmol of calcium per liter? Why?
Fantastic news! We've Found the answer you've been seeking!
Step by Step Answer:
a The scatterplots of data are given here b The following Minitab output contains the eq...View the full answer

Answered By
Shikhil Gilbert
Charismatic and dependable Tutor with 3 years of experience delivering educational assistance and instruction to various levels of learners. Committed to providing students with necessary tools to achieve academic goals, instilling love of learning and cooperative teamwork. Adept in application of excellent communication and problem solving skills.
Education
• International Indian School Dammam, KSA
• Viswabharathy Public School, Trivandrum
• Mother Theresa College, Trivandrum
Work History
?Math-One Institute - Tutor
Trivandrum
03/2017 - 05/2019
~ Observed and evaluated students' performance, behaviour, social
development and physical health.
~ Enhanced student learning by optimizing wide range of instructional
approaches and innovative classroom activities.
~ Evaluated and revised lesson plans and course content to facilitate and
moderate classroom discussions and student centered learning.
~ Kept students on-task with proactive behaviour modification and positive
reinforcement strategies.
?Private Tuition
Trivandrum
08/2019
Skills
1. Special education
2. Experiential learning
3. Test Proctoring
4. Tailoring Curriculum Plans
5. Classcape knowledge
6. Audio-visual aid implementation
7. Technological Instruction
8. Student-Centered Learning
0 Reviews
10+ Question Solved
Related Book For 

An Introduction To Statistical Methods And Data Analysis
ISBN: 9781305465527
7th Edition
Authors: R. Lyman Ott, Micheal T. Longnecker
Question Posted:
