

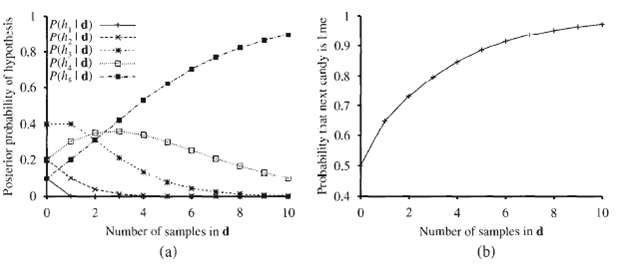
The data used for Figure can be viewed as being generated by h5. For each of the
Question:
The data used for Figure can be viewed as being generated by h5. For each of the other four hypotheses, generate a data set of length 100 and plot the corresponding graphs for P (hi?d1... dm) and P (D m + 1 = lime?d1. . . dm). Comment on your results.
Fantastic news! We've Found the answer you've been seeking!
Step by Step Answer:
The code for this exercise is a straightforward implementation of Equations 201 and Figure shows the ...View the full answer

Answered By
Ehsan Mahmood
I’ve earned Masters Degree in Business Studies and specialized in Accounts & Finance. Couple with this, I have earned BS Sociology from renowned institute of Pakistan. Moreover, I have humongous teaching experience at Graduate and Post-graduate level to Business and humanities students along with more than 7 years of teaching experience to my foreign students Online. I’m also professional writer and write for numerous academic journals pertaining to educational institutes periodically.
248+ Reviews
287+ Question Solved
Related Book For 
Artificial Intelligence A Modern Approach
ISBN: 978-0137903955
2nd Edition
Authors: Stuart J. Russell and Peter Norvig
Question Posted:
