

The following data give the results of a sample survey. The letters Y, N, and D represent
Question:
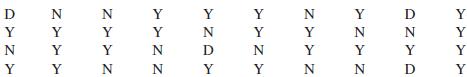
a. Prepare a frequency distribution table.
b. Calculate the relative frequencies and percentages for all categories.
c. What percentage of the elements in this sample belongs to category Y?
d. What percentage of the elements in this sample belongs to category N or D?
e. Draw a pie chart for the percentage distribution.
The word "distribution" has several meanings in the financial world, most of them pertaining to the payment of assets from a fund, account, or individual security to an investor or beneficiary. Retirement account distributions are among the most...
Fantastic news! We've Found the answer you've been seeking!
Step by Step Answer:
a and b Category Frequency Relative Frequency ...View the full answer

Answered By
Deborah Joseph
My experience has a tutor has helped me with learning and relearning. You learn everyday actually and there are changes that are made to the curriculum every time so being a tutor has helped in keeping me updated about the present curriculum and all.
I have also been able to help over 100 students achieve better grades particularly in the categories of Math and Biology both in their internal examinations and external examinations.
2+ Reviews
10+ Question Solved
Related Book For 

Question Posted:
