

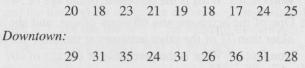
The following data sets give the driving speeds in miles per hour of the first nine cars
Question:
The following data sets give the driving speeds in miles per hour of the first nine cars to pass through a school zone and the first nine cars to pass through a downtown intersection.
a. Find the mean, median, and range for each of the two data sets.
b. Give the five-number summary and draw a boxplot for each of the two data sets.
c. Find the standard deviation for each of the two data sets.
d. Apply the range rule of thumb to estimate the standard deviation of each of the two data sets. How well does the rule work in each case? Briefly discuss why it does or does not work well.
Fantastic news! We've Found the answer you've been seeking!
Step by Step Answer:
a b c Using Excel we find that the standard deviations are 29 mph for t...View the full answer

Answered By
Leah Muchiri
I am graduate in Bachelor of Actuarial Science and a certified accountant. I am also a prolific writer with six years experience in academic writing. My working principle are being timely and delivering 100% plagiarized free work. I usually present a precised solution to every work am assigned to do. Most of my student earn A++ GRADE using my precised and correct solutions.
52+ Reviews
125+ Question Solved
Related Book For 

Statistical Reasoning for Everyday Life
ISBN: 978-0321817624
4th edition
Authors: Jeff Bennett, Bill Briggs, Mario F. Triola
Question Posted:
