

The following data shows the weekly purchases of printers at a particular electronic store. The data can
Question:
The following data shows the weekly purchases of printers at a particular electronic store. The data can also be found in the Excel file weekly printer demand.xlsx.
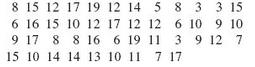
Using α = 0.05, perform a chisquare test to determine if the number of printers sold per week follows the normal probability distribution. Note that x = 11.2 and s = 4.3.
Fantastic news! We've Found the answer you've been seeking!
Step by Step Answer:
H 0 The number of printers sold per week at the elec...View the full answer

Answered By
Caroline Kinuthia
Taking care of the smaller details in life has a larger impact in our general well being, and that is what i believe in. My name is Carol. Writing is my passion. To me, doing a task is one thing, and delivering results from the task is another thing. I am a perfectionist who always take things seriously and deliver to the best of my knowledge.
1933+ Reviews
4269+ Question Solved
Related Book For 

Question Posted:
