

The following scatter plot and simple regression results used revenue as a potential cost driver for research
Question:
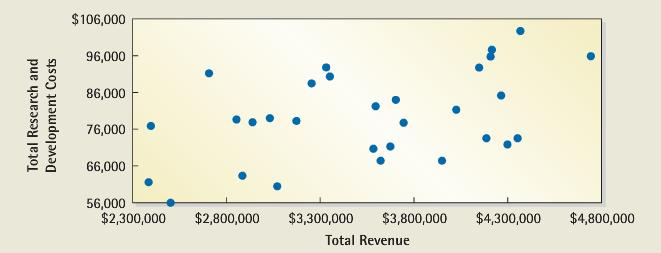
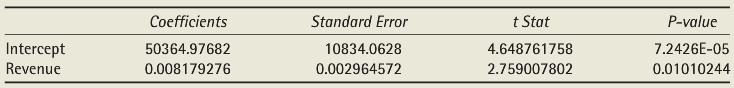
The following scatter plot and simple regression results used revenue as a potential cost driver for research and development costs.
SUMMARY OUTPUT
Regression Statistics
Multiple R ……………....…. 0.462332038
R Square ……………….....… 0.213750914
Adjusted R Square ……… 0.185670589
Standard Error ………….... 10894.44062
Observations …………...… 30
REQUIRED
A. Discuss whether the scatter plot suggests that revenue is a cost driver for research and development costs
B. Using the regression results, write the cost function for research and development costs.
C. Based on the regression results, discuss whether it would be appropriate to use total revenue as a cost driver for research and development costs.
D. If you use the cost function from part (B) to estimate next month’s research and development costs, what assumptions are you making? Identify at least three assumptions and discuss their reasonableness.
Step by Step Answer:
A The plot shows costs that are widely scattered However there does appear to be a general upward tr...View the full answer


Cost Management Measuring Monitoring and Motivating Performance
ISBN: 978-0470769423
2nd edition
Authors: Leslie G. Eldenburg, Susan K. Wolcott
