

The following table shows the U.S. market share for smartphone manufacturers in 2013 according to the research
Question:
The following table shows the U.S. market share for smartphone manufacturers in 2013 according to the research firm comScore. The table also shows the frequency of purchases of smart phones by brand for a random sample of customers during 2014.
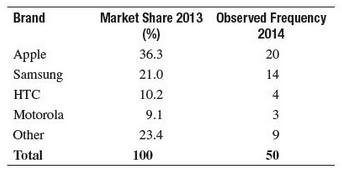
a. Using α = 0.05, perform a chisquare test to determine if the observed frequencies in the table are consistent with the comScore report.
b. Determine the pvalue for the chisquare test statistic using Excel and interpret its meaning.
Fantastic news! We've Found the answer you've been seeking!
Step by Step Answer:
a H 0 The market share for US smartphone manufacturers in 2014 is consistent with ...View the full answer

Answered By
Jonas Araujo
I have recently received the degree of PhD. In Physics by the Universidade Federal do Maranhão after spending a term in Durham University, as I have been awarded a scholarship from a Brazilian mobility program. During my PhD. I have performed research mainly in Theoretical Physics and published works in distinguished Journals (check my ORCID: https://orcid.org/0000-0002-4324-1184).
During my BSc. I have been awarded a scholarship to study for a year in the University of Evansville, where I have worked in detection-analysis of photon correlations in the the Photonics Laboratory. There I was a tutor in Electromagnetism, Classical Mechanics and Calculus for most of that year (2012).
I am very dedicated, honest and a fast learner, but most of all, I value a job well done.
1+ Reviews
10+ Question Solved
Related Book For 

Question Posted:
