

The frequency bar chart shows last months delivery times for packages shipped through National Express by customers
Question:
The frequency bar chart shows last month’s delivery times for packages shipped through National Express by customers who used National’s three-day delivery time option.
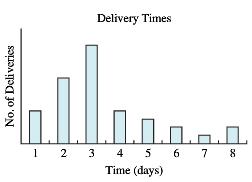
a. In one or two sentences, summarize the information that the chart is providing.
b. Show the approximate location of the mean, median and mode for the delivery time distribution. (Don’t make any detailed calculations. Just give an “educated” estimate.)
c. The MAD for the distribution looks to be approximately
i) 1.5
ii) 5.5
iii) 8.5
iv) 15
d. The standard deviation for the distribution looks to be approximately
i) 1
ii) 2
iii) 8
iv) 12
DistributionThe word "distribution" has several meanings in the financial world, most of them pertaining to the payment of assets from a fund, account, or individual security to an investor or beneficiary. Retirement account distributions are among the most...
Fantastic news! We've Found the answer you've been seeking!
Step by Step Answer:
a Clearly the company isnt meeting the 3day standard for a significant number o...View the full answer

Answered By
Aysha Ali
my name is ayesha ali. i have done my matriculation in science topics with a+ . then i got admission in the field of computer science and technology in punjab college, lahore. i have passed my final examination of college with a+ also. after that, i got admission in the biggest university of pakistan which is university of the punjab. i am studying business and information technology in my university. i always stand first in my class. i am very brilliant client. my experts always appreciate my work. my projects are very popular in my university because i always complete my work with extreme devotion. i have a great knowledge about all major science topics. science topics always remain my favorite topics. i am also a home expert. i teach many clients at my home ranging from pre-school level to university level. my clients always show excellent result. i am expert in writing essays, reports, speeches, researches and all type of projects. i also have a vast knowledge about business, marketing, cost accounting and finance. i am also expert in making presentations on powerpoint and microsoft word. if you need any sort of help in any topic, please dont hesitate to consult with me. i will provide you the best work at a very reasonable price. i am quality oriented and i have 5 year experience in the following field.
matriculation in science topics; inter in computer science; bachelors in business and information technology
_embed src=http://www.clocklink.com/clocks/0018-orange.swf?timezone=usa_albany& width=200 height=200 wmode=transparent type=application/x-shockwave-flash_
11+ Reviews
14+ Question Solved
Related Book For 

Understanding Business Statistics
ISBN: 978-1118145258
1st edition
Authors: Stacey Jones, Tim Bergquist, Ned Freed
Question Posted:
