

The histogram in Figure 3.12 depicts cotinine levels (in milligrams per milliliter) of a sample of subjects
Question:
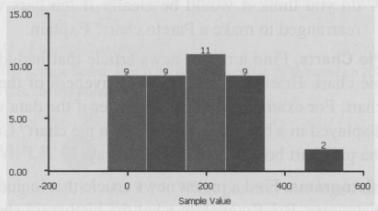
The histogram in Figure 3.12 depicts cotinine levels (in milligrams per milliliter) of a sample of subjects who smoke cigarettes. Cotinine is a metabolite of nicotine, which means that cotinine is produced by the body when nicotine is absorbed. The data are from the Third National Health and Nutrition Examination Survey.
a. How many subjects are represented in the histogram?
b. How many subjects have cotinine levels below 400?
c. How many subjects have cotinine levels above 150?
d. What is the highest possible cotinine level of a subject represented in this histogram?
Figure 3.12
Fantastic news! We've Found the answer you've been seeking!
Step by Step Answer:
a The sum of the frequencies shown at the top of each bar is 40 so there are 40 ...View the full answer

Answered By
Carly Cimino
As a tutor, my focus is to help communicate and break down difficult concepts in a way that allows students greater accessibility and comprehension to their course material. I love helping others develop a sense of personal confidence and curiosity, and I'm looking forward to the chance to interact and work with you professionally and better your academic grades.
12+ Reviews
21+ Question Solved
Related Book For 

Statistical Reasoning for Everyday Life
ISBN: 978-0321817624
4th edition
Authors: Jeff Bennett, Bill Briggs, Mario F. Triola
Question Posted:
