

The output below is from a multiple linear regression analysis attempting to link winning percentage (y) to
Question:
The output below is from a multiple linear regression analysis attempting to link winning percentage (y) to weekly practice time (x1), average speed of first serve (x2), and first serve percentage (x3) using data from a group of 12 professional tennis players over the past year. Notice that some of the values in the table are missing.
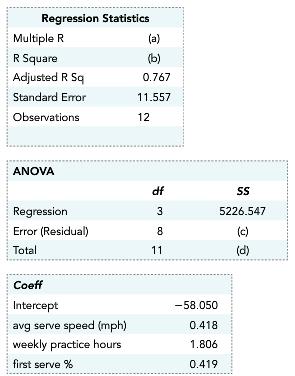
a. Fill in the missing values indicated by ().
b. Identify and interpret the estimated regression coefficients for x1, x2, and x3.
Fantastic news! We've Found the answer you've been seeking!
Step by Step Answer:
a c Since s yx SSE nk 1 s yx 2 123111557 2 1068514 d SST SSR SSE 5226547 1068514 6295061 b ...View the full answer

Answered By
Branice Buyengo Ajevi
I have been teaching for the last 5 years which has strengthened my interaction with students of different level.
1+ Reviews
10+ Question Solved
Related Book For 

Understanding Business Statistics
ISBN: 978-1118145258
1st edition
Authors: Stacey Jones, Tim Bergquist, Ned Freed
Question Posted:
