

The table below gives experimental results for a measurement of the period of motion T of an
Question:
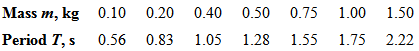
The table below gives experimental results for a measurement of the period of motion T of an object of mass m suspended on a spring versus the mass of the object. These data are consistent with a simple equation expressing T as a function of m of the form T = Cmn, where C and n are constants and n is not necessarily an integer.
(a) Find n and C. (There are several ways to do this. One is to guess the value of n and check by plotting T versus mn on graph paper. If your guess is right, the plot will be a straight line. Another is to plot log T versus log m. The slope of the straight line on this plot is n.)
(b) Which data points deviate the most from a straight-line plot of T versus mn?
Step by Step Answer:
a We will use a judicious guessing procedure Note tha...View the full answer


Fundamentals of Ethics for Scientists and Engineers
ISBN: 978-0195134889
1st Edition
Authors: Edmund G. Seebauer, Robert L. Barry
