

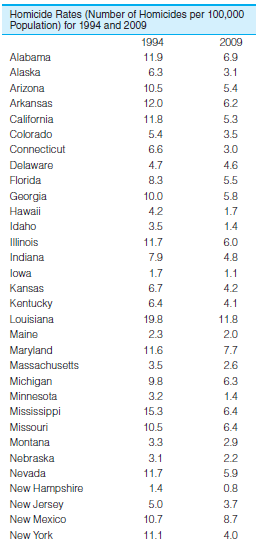
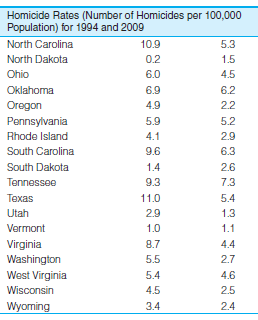
The table below presents the homicide rates for the 50 states for two different years. a. Calculate
Question:
a. Calculate the mean and median rates for both years. Remember to rank-order the states before finding the median.
b. Compare the mean and median for each year separately. Which is the higher value? Why?
c. If you removed Louisiana (the state with the highest rate in both years) from the distributions and recalculated, what would happen to the mean? To the median? Why?
d. If you removed North Dakota (the state with the lowest rate) from the 1994 distribution and New Hampshire (the state with the lowest rate) from the 2009 distribution and recalculated, what would happen to the means and medians for both years? Why?
The word "distribution" has several meanings in the financial world, most of them pertaining to the payment of assets from a fund, account, or individual security to an investor or beneficiary. Retirement account distributions are among the most...
Fantastic news! We've Found the answer you've been seeking!
Step by Step Answer:
a 1994 Mean 707 Median 635 2009 Mean 428 Median 430 b I...View the full answer

Answered By
Antony Mutonga
I am a professional educator and writer with exceptional skills in assisting bloggers and other specializations that necessitate a fantastic writer. One of the most significant parts of being the best is that I have provided excellent service to a large number of clients. With my exceptional abilities, I have amassed a large number of references, allowing me to continue working as a respected and admired writer. As a skilled content writer, I am also a reputable IT writer with the necessary talents to turn papers into exceptional results.
2+ Reviews
10+ Question Solved
Related Book For 

The Essentials Of Statistics A Tool For Social Research
ISBN: 9781111829568
3rd Edition
Authors: Joseph F. Healey
Question Posted:
