

The table shows a sample of late arrival times (in minutes) for two major airlines flying the
Question:
The table shows a sample of late arrival times (in minutes) for two major airlines flying the route from New York’s Kennedy Airport to London’s Gatwick Airport.
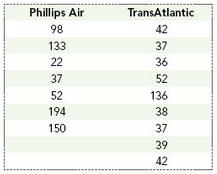
a. Use a 95% confidence level and construct the appropriate interval estimate of the difference in average late arrival times for the two populations represented, assuming that the two population distributions have unequal standard deviations.
b. Compare your result in part a to the result you would produce if you assume that the two population distributions have equal standard deviations.
Fantastic news! We've Found the answer you've been seeking!
Step by Step Answer:
98 s 1 642 n 1 7 51 s 2 322 n 2 9 a df 495616577811659 49561659440 ...View the full answer

Answered By
Balram Balram
I honestly saying when someone ask me any question then i will try my best to solve their problems. if i know then i can easily explain with easy method. About my qualification i have qualified csir net (jrf) which is national eligibility test for assistant professor.
0 Reviews
10+ Question Solved
Related Book For 

Understanding Business Statistics
ISBN: 978-1118145258
1st edition
Authors: Stacey Jones, Tim Bergquist, Ned Freed
Question Posted:
