

The table shows gasoline prices ($/gallon) and natural gas prices ($/1000 cu ft, residential) for the years
Question:
The table shows gasoline prices ($/gallon) and natural gas prices ($/1000 cu ft, residential) for the years 1993-2010
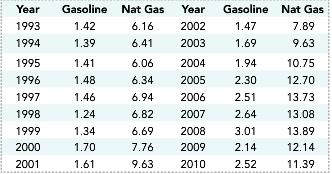
a. Compute the coefficient of variation for each data set. (Gasoline σ = .52; natural gas σ = 2.81)
b. As measured by the coefficient of variation, which data set shows the greater variability?
Fantastic news! We've Found the answer you've been seeking!
Step by Step Answer:
mean Std de...View the full answer

Answered By
GERALD KAMAU
non-plagiarism work, timely work and A++ work
6+ Reviews
11+ Question Solved
Related Book For 

Understanding Business Statistics
ISBN: 978-1118145258
1st edition
Authors: Stacey Jones, Tim Bergquist, Ned Freed
Question Posted:
