

The table shows Minitab descriptive statistics for the weight of some women (weight_f) and men (weight_m), and
Question:
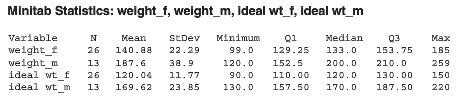
The table shows Minitab descriptive statistics for the weight of some women (weight_f) and men (weight_m), and the self-reported ideal weights for both.
a. Subtract the women€™s mean weight from their mean ideal weight to find the mean desired weight change. Did the women (as a group) tend to want to lose or to gain weight? How do you know?
b. Subtract the men€™s mean weight from their mean ideal weight to find the mean desired weight change. Did the men (as a group) tend to want to lose or to gain weight? How do you know?
c. On average, which group wanted the greatest weight change? Compare the mean desired weight loss for women and men.
d. Which group€™s real weights had more variation as shown by the standard deviations (in the column headed StDev)?
Step by Step Answer:
a The mean desired weight loss for the women was 14088 12004 2084 o...View the full answer


Introductory Statistics Exploring The World Through Data
ISBN: 9780321978271
2nd Edition
Authors: Robert Gould, Colleen Ryan
