

The table shows the smallest to largest winning payout (per $1 wagered) for winners of the Kentucky
Question:
The table shows the smallest to largest winning payout (per $1 wagered) for winners of the Kentucky Derby, 1970–2011
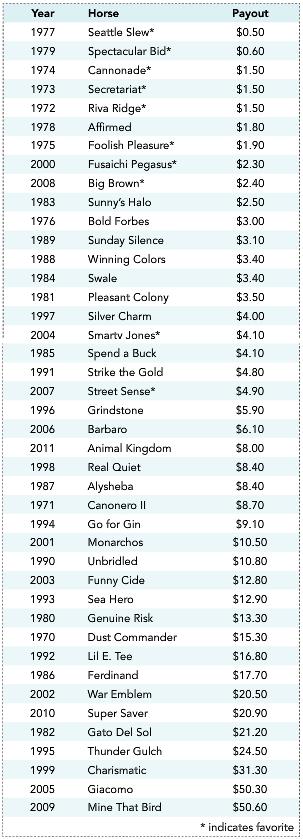
a. Draw the box plot for the payout data. Use the “1.5 x inter-quartile range” approach to identify any outliers.
b. Use the “3-standard-deviation” approach to identify any outliers. (The mean payout is $10.45; the standard deviation is $11.52.)
c. Calculate the z-score for the value $16.80.
Fantastic news! We've Found the answer you've been seeking!
Step by Step Answer:
a First Quartile position 42 105 Round up to 11 Q1 is the 11 th value in the orde...View the full answer

Answered By
Nazrin Ziad
I am a post graduate in Zoology with specialization in Entomology.I also have a Bachelor degree in Education.I posess more than 10 years of teaching as well as tutoring experience.I have done a project on histopathological analysis on alcohol treated liver of Albino Mice.
I can deal with every field under Biology from basic to advanced level.I can also guide you for your project works related to biological subjects other than tutoring.You can also seek my help for cracking competitive exams with biology as one of the subjects.
2+ Reviews
10+ Question Solved
Related Book For 

Understanding Business Statistics
ISBN: 978-1118145258
1st edition
Authors: Stacey Jones, Tim Bergquist, Ned Freed
Question Posted:
