Using the data in file statepop.dat, draw a histogram, using the weights, of the number of veterans.
Question:
Using the data in file statepop.dat, draw a histogram, using the weights, of the number of veterans. Howdoes this compare with a histogram that does not use the weights?
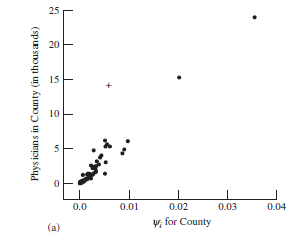
The file statepop.dat contains data from an unequal-probability sample of 100 counties in the United States. Counties were chosen using the cumulative-size method from the listings in the County and City Data Book (U.S. Census Bureau, 1994) with probabilities proportional to their populations. The total population for all counties is M0 = Ni =1 Mi = 255,077,536. Sampling was done with replacement, so very large counties occur multiple times in the sample: Los Angeles County, with the largest population in the United States, occurs four times. One of the quantities recorded for each countywas the number of physicians in the county. You would expect larger counties to have more physicians, so pps sampling should work well for estimating the total number of physicians in the United States. You must be careful in plotting data from an unequal-probability sample, as you need to consider the unequal probabilities when interpreting the plots. A plot of ti versus ψi (Figure 6.1a given below) tells the efficiency of the unequal-probability design: The design works well when the plot shows positive correlation. A histogram of ti in a pps sample will not give a representative view of the population of psus, as psus with large ψi's are over represented in the sample.
Figure 6.1a
Step by Step Answer:
Without Weight Using the weights makes a huge difference ...View the full answer