

Walmart has an interest in monitoring the average back to school spending for grade school students year
Question:
Walmart has an interest in monitoring the average back to school spending for grade school students year to year. The following table shows the average back to school spending of households randomly sampled in 2013 and 2014 along with the population standard deviations and sample sizes for each sample.
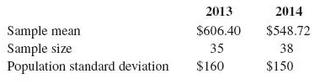
a. Perform a hypothesis test using α = 0.10 to determine if the average household back to school spending in 2013 was different than it was in 2014.
b. Determine the p value and interpret the results.
c. Verify your results using PHStat.
Fantastic news! We've Found the answer you've been seeking!
Step by Step Answer:
a There is not enough evidence that the average household backtosch...View the full answer

Answered By
Mary Njunu
I posses Vast, diversified knowledge and excellent grammar as a result of working in ACADEMIC WRITING for more than 5 years. I deliver work in various disciplines with assurance of quality work. I purpose at meeting the clients’ expectations precisely. Let’s work together for the best and phenomenal grades.
928+ Reviews
2551+ Question Solved
Related Book For 

Question Posted:
