

In some studies, an investigator has n (x, y) pairs sampled from one population and m (x,
Question:
In some studies, an investigator has n (x, y) pairs sampled from one population and m (x, y) pairs from a second population. Let b and br denote the slopes of the first and second population lines, respectively, and let b and b’ denote the estimated slopes calculated from the first and second samples, respectively. The investigator may then wish to test the null hypothesis H0: b2 br = 0 (that is, b = br) against an appropriate alternative hypothesis. Suppose that s2, the variance about the population line, is the same for both populations. Then this common variance can be estimated by where SSResid and SSResid9 are the residual sums of squares for the first and second samples, respectively. With  and second samples, respectively, the test statistic is
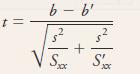
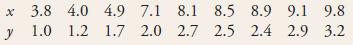
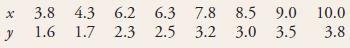
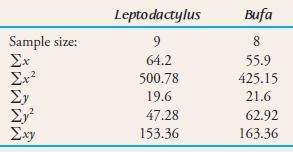
When H0 is true, this statistic has a t distribution based on (n + m – 4) df. The data below are a subset of the data in the article “Diet and Foraging Model of Bufa marinus and Leptodactylus ocellatus” (Journal of Herpetology [1984]: 138– 146). The independent variable x is body length (cm) and the dependent variable y is mouth width (cm), with n = 9 observations for one type of nocturnal frog and m = 8 observations for a second type. Carry out a test to determine if the slopes of the true regression lines for the two different frog populations are equal. Use a sigificance level of .05. (Summary statistics are also given in the accompanying table.)
Leptodactylus ocellatus
Bufa marinus
The word "distribution" has several meanings in the financial world, most of them pertaining to the payment of assets from a fund, account, or individual security to an investor or beneficiary. Retirement account distributions are among the most...
Step by Step Answer:
For leptodactylus SSResid 030989 Sample size 9 b031636 Sxx4282 For bufa SSRe...View the full answer


Statistics The Exploration & Analysis Of Data
ISBN: 9780840058010
7th Edition
Authors: Roxy Peck, Jay L. Devore
