With the explosion of computer hardware and software during the 1970s and 1980s, companies began developing models
Question:
With the explosion of computer hardware and software during the 1970s and 1980s, companies began developing models to assess the technical risk for the computer hardware and software effort. One such model is discussed in this problem. Although some people contend that there may still exist applicable use for this model, others argue that the model is obsolete and flawed with respect to current thinking. After reading the paragraphs below, explain why the model may have limited use today for technical risk management.
Previously, we showed that risk quantification could be found by use of an expected-value calculation. However, there are more sophisticated approaches that involve templates combined with the expected-value model. Here, we can develop mathematical expressions for failure and risk for specific types of projects.
Risk can be simply modeled as the interaction of two variables: probability of failure (Pf) and the effect or consequence of the failure (Cf). Consequences may be measured in terms of technical performance, cost, or schedule. A simple model can be used to highlight areas where the probability of failure (Pf) is high (even if there is a low probability of occurrence). Mathematically, this model can be expressed as the union of two sets, Pf and Cf. Table 17–15 shows a mathematical model for risk assessment on hardware–software projects. In other words, the risk factor (defined as Pf × Cf) will be largest where both Pf and Cf are large, and may be high if either factor is large.
In this case, Pf is estimated by looking at hardware and software maturity, complexity, and dependency on interfacing items. The probability of failure, Pf, is then quantified from ratings similar to the factors in Table 17–15. Cf is calculated by looking at the technical, cost, and schedule implications of failure. For example, consider an item with the following characteristics:
● Uses off-the-shelf hardware with minor modifications to software database
● Is based on simply designed hardware
● Requires software of somewhat minor increase in complexity
● Involves a new database to be developed by a subcontractor
Using Table 17–15, the probability of failure, Pf, would be calculated as follows:
Assume that the weighting factors for a, b, c, d, and e are 20 percent, 10 percent, 40 percent, 10 percent, and 20 percent, respectively.
PM (hardware) = 0.1 ......0.2 PM (h) = 0.02
PM (software) = 0.3 ......0.1 PM (s) = 0.03
PC (hardware) = 0.1 ......0.4 PC (h) = 0.04
PC (software) = 0.3 ......0.1 PC (s) = 0.03
PD = 0.9 ......0.2 PD = 0.18
= 0.30
Then, assuming the weighting factors shown in equation (2) of Table 17–15 are as indicated above, the Pf on this item would be 0.30. If the consequence of the item’s failure because of technical factors would cause some problems of a correctable nature, but correction would result in an 8 percent cost increase and two-month schedule slip, the consequence of failure, Cf, would be calculated from Table 17–15 as follows:
Ct = 0.3 .....0.4 Ct = 0.12
Cc= 0.5 .....0.5 Cc = 0.25
Cs = 0.5 .....0.1 Cs = 0.12
0.42
Then Cf for this item [assuming that the weighting factors in equation (3) of Table 17–15 are as indicated above] would be 0.42.
From equation (1) of Table 17–14, the risk factor would be
0.30 + 0.42 _ (0.30) (0.42) = 0.594
In other words, the risk associated with this item is medium. Because most of the risk associated with this example arises from software changes, in particular the use of a subcontractor in this area, we can conclude that the risk can be reduced when the computer software developer is held “accountable for work quality and is subject to both incentives and penalties during all phases of the system life cycle.”
Similar risk analyses would be performed for all other items and a risk factor would be obtained for each identified risk area. Risk areas would then be prioritized according to source of the risk (for example, are other items exhibiting excessive risk due to subcontractor software development?).
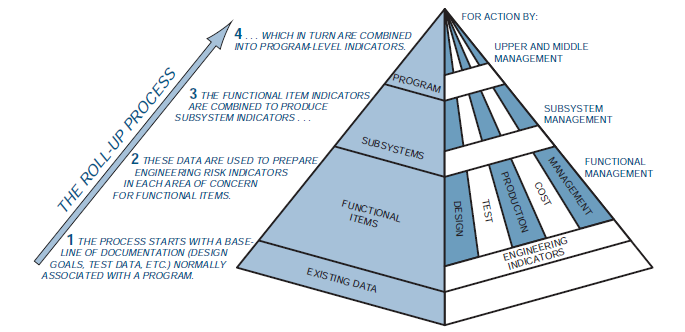
Figure 1722

Step by Step Answer:

Project Management A Systems Approach to Planning Scheduling and Controlling
ISBN: 978-0470278703
10th Edition
Authors: Harold Kerzner


