

Your task in this problem will be to use a spreadsheet to generate a Txy diagram for
Question:
Your task in this problem will be to use a spreadsheet to generate a Txy diagram for a two-component system, using Raoult?s law to express the vapor?liquid equilibrium distribution of each species. The spreadsheet will be constructed for the chloroform?benzene system at I atm (for which Raoult?s law is not a very good approximation), but it can then be used for any other system by substituting different Antoine equation constants.
(a) Look up the normal boiling points of chloroform and benzene and sketch the expected shape of a Txy diagram for these two species at 1atm. Do not perform any calculations.
(b) Create a spreadsheet that contains a title line in Row 1 (Txy Diagram for an Ideal Binary Solution), the names of the two species (Chloroform and Benzene), and the labels (A, B. C) and values of their Antoine equation constants (Rows 3 and 4), and a label P(mm Hg) = and in the adjacent cell the pressure for which the diagram is to be generated (760) (Row 5). Then insert column headings x, T, y, p1, p2, pl + p2 in Row 7. These headings denote the mole fraction of the first species in the liquid phase, the equilibrium temperature, the mole fraction of the first species in the vapor phase, the partial pressures of the first and second species in the vapor phase, and the sum of the partial pressures of the two species. In the first column (under the x heading) enter 0.0, 0.05, 0.10, ... , 0.95, 1.0. (You should be able to enter a formula in the second cell and then copy it into the remaining cells of the column rather than entering each number individually.) Then carry out the following procedure for each x value.
- Enter a temperature (for all but x = 0 and x = 1 you will have to guess a value).
- Enter formulas for the two partial pressures (use Raoult?s law) and for their sum, and then enter a formula for y.
- Vary the value of T to determine the temperature at which the sum of the component partial pressures equals the specified total pressure of the system (760 mm Hg). This calculation can easily be done using the goal seek tool on most spreadsheet programs. or it can be done by manual trial and error. The row now contains the correct x and y values for the given temperature. Once you have done the calculation for the first x value, you should be able to copy formulas into subsequent rows rather than having to enter them again. When the calculation has been completed for all rows of the table, draw the Txy diagram (using the graphing facility of your spreadsheet program if possible, otherwise by hand).
(c) Explain in your own words exactly what you are doing in the bulleted sequence of steps in part (b) and give the relevant formulas. The phrase ?bubble point? should appear in your explanation.
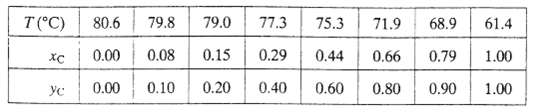
(d) The following vapor?liquid equilibrium data have been obtained for mixtures of chloroform (C) and benzene (B) at 1 atm. Plot these data on the graph generated in part (b). Estimate the percentage errors in the Raoult?s law values of the bubble-point temperature and vapor mole fraction for xC = 0.44, taking the tabulated values to be correct. Why does Raoult?s law give poor estimates for this system?
The word "distribution" has several meanings in the financial world, most of them pertaining to the payment of assets from a fund, account, or individual security to an investor or beneficiary. Retirement account distributions are among the most...
Step by Step Answer:
b c a B benzene C chloroform At 1 atm ...View the full answer


Elementary Principles of Chemical Processes
ISBN: 978-0471720638
3rd Edition
Authors: Richard M. Felder, Ronald W. Rousseau
