

Find the range of the data set represented by the graph. Median Annual Income by State 12
Question:
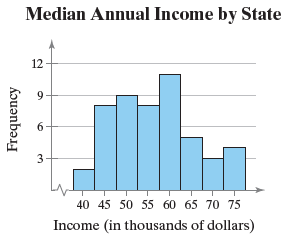
Find the range of the data set represented by the graph.
Fantastic news! We've Found the answer you've been seeking!
Step by Step Answer:
Range Max ...View the full answer

Answered By
Morgan Njeri
Very Versatile especially in expressing Ideas in writings.
Passionate on my technical knowledge delivery.
Able to multitask and able to perform under pressure by handling multiple challenges that require time sensitive solution.
Writting articles and video editing.
Revise written materials to meet personal standards and satisfy clients demand.
Help Online Students with their course work.
12+ Reviews
38+ Question Solved
Related Book For 

Elementary Statistics Picturing The World
ISBN: 9780134683416
7th Edition
Authors: Ron Larson, Betsy Farber
Question Posted:
