

The electron micrographs shown in Figure Q1720A were obtained from a population of microtubules that were growing
Question:
The electron micrographs shown in Figure Q17–20A were obtained from a population of microtubules that were growing rapidly. Figure Q17–20B was obtained from microtubules undergoing “catastrophic” shrinking. Comment on any differences between A and B, and suggest likely explanations for the differences that you observe.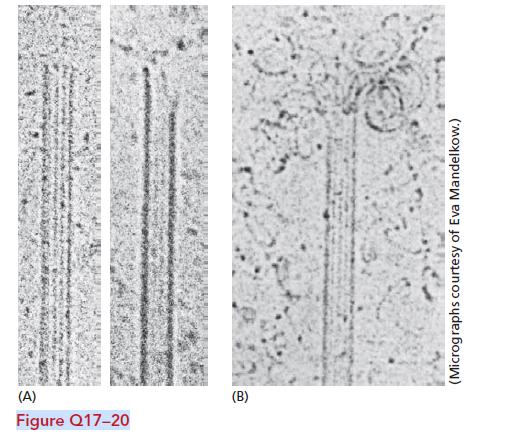
Fantastic news! We've Found the answer you've been seeking!
Step by Step Answer:

Related Book For 

Essential Cell Biology
ISBN: 9780393680362
5th Edition
Authors: Bruce Alberts, Karen Hopkin, Alexander Johnson, David Morgan, Martin Raff, Keith Roberts, Peter Walter
Question Posted:
