

The graph in Figure 18.20 shows company output as a function of the number of workers. In
Question:
The graph in Figure 18.20 shows company output as a function of the number of workers. In Problems 9-12, find the average rate of change of output for the given change in the number of workers.
Figure 18.20
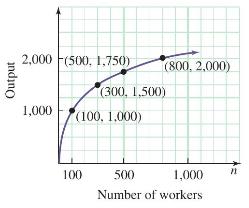
100 to 500
Fantastic news! We've Found the answer you've been seeking!
Step by Step Answer:
In order to calculate the average rate of change of output for the given change in the number of wor...View the full answer

Answered By
Mamba Dedan
I am a computer scientist specializing in database management, OS, networking, and software development. I have a knack for database work, Operating systems, networking, and programming, I can give you the best solution on this without any hesitation. I have a knack in software development with key skills in UML diagrams, storyboarding, code development, software testing and implementation on several platforms.
79+ Reviews
170+ Question Solved
Related Book For 

Question Posted:
