

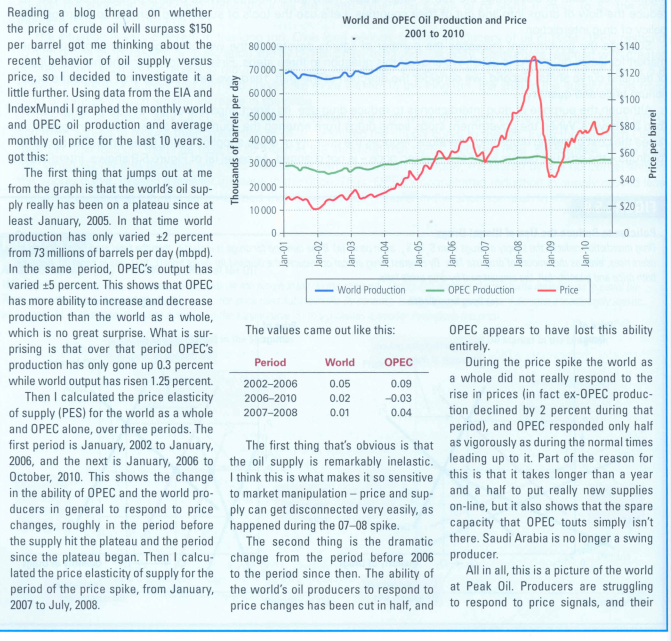
The average oil price is listed as follow: Jan 31st, 2015???????$47.11 Aug 31st 2014??????.$100.05 Dec 31st 2014???????.$60.7
Fantastic news! We've Found the answer you've been seeking!
Question:
The average oil price is listed as follow:
Jan 31st, 2015???????$47.11
Aug 31st 2014??????.$100.05
Dec 31st 2014???????.$60.7
Based on the information provided above, what is the price elasticity of demand and supply for the dates mentioned above? You may compare your results with the values cited in the article and explain why the divergence in the values.
Expert Answer:

Related Book For 
Intermediate Accounting
ISBN: 978-0132162302
1st edition
Authors: Elizabeth A. Gordon, Jana S. Raedy, Alexander J. Sannella
Posted Date:
