

4. 5. 6. 7. Using the teacher's original grade scale (not your results from question number...
Fantastic news! We've Found the answer you've been seeking!
Question:
Transcribed Image Text:
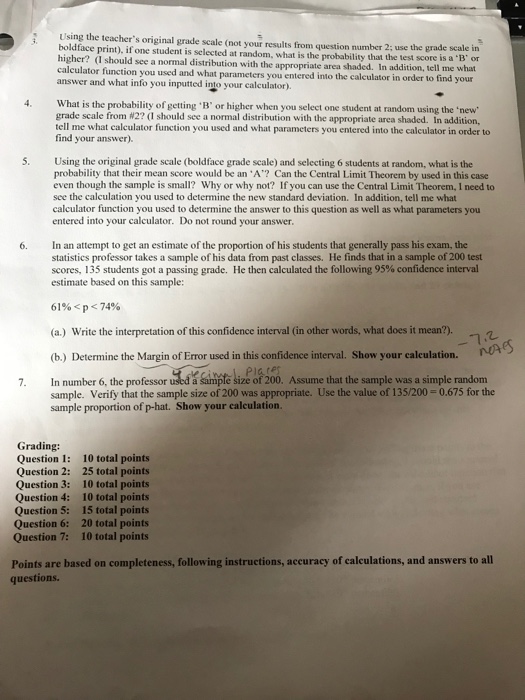
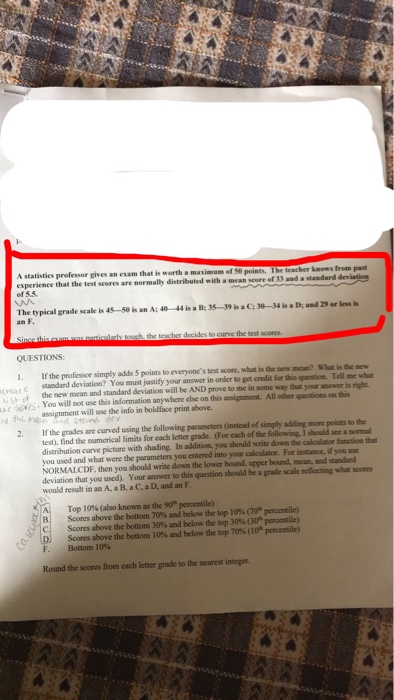
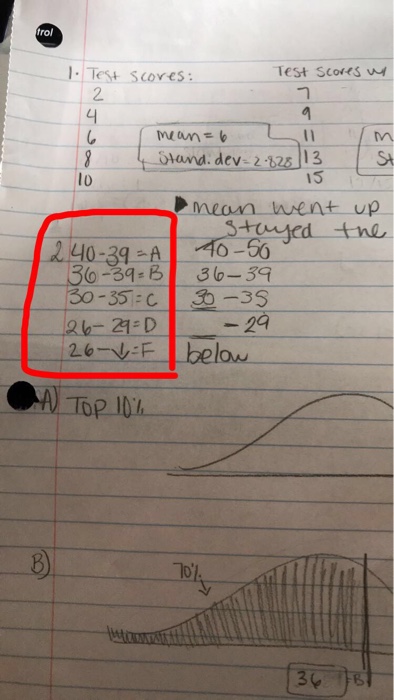
4. 5. 6. 7. Using the teacher's original grade scale (not your results from question number 2; use the grade scale in boldface print), if one student is selected at random, what is the probability that the test score is a 'B' or higher? (I should see a normal distribution with the appropriate area shaded. In addition, tell me what calculator function you used and what parameters you entered into the calculator in order to find your answer and what info you inputted into your calculator). What is the probability of getting 'B' or higher when you select one student at random using the 'new' grade scale from #2? (I should see a normal distribution with the appropriate area shaded. In addition, tell me what calculator function you used and what parameters you entered into the calculator in order to find your answer). Using the original grade scale (boldface grade scale) and selecting 6 students at random, what is the probability that their mean score would be an 'A'? Can the Central Limit Theorem by used in this case even though the sample is small? Why or why not? If you can use the Central Limit Theorem, I need to see the calculation you used to determine the new standard deviation. In addition, tell me what calculator function you used to determine the answer to this question as well as what parameters you entered into your calculator. Do not round your answer. In an attempt to get an estimate of the proportion of his students that generally pass his exam, the statistics professor takes a sample of his data from past classes. He finds that in a sample of 200 test scores, 135 students got a passing grade. He then calculated the following 95% confidence interval estimate based on this sample: 61% < p < 74% (a.) Write the interpretation of this confidence interval (in other words, what does it mean?). (b.) Determine the Margin of Error used in this confidence interval. Show your calculation. ecimal. Places In number 6, the professor used a sample size of 200. Assume that the sample was a simple random sample. Verify that the sample size of 200 was appropriate. Use the value of 135/200=0.675 for the sample proportion of p-hat. Show your calculation. Grading: Question 1: Question 2: Question 3: Question 4: Question 5: 10 total points 25 total points 10 total points 10 total points 15 total points Question 6: 20 total points Question 7: 10 total points -7.2 notes Points are based on completeness, following instructions, accuracy of calculations, and answers to all questions. A statistics professor gives an exam that is worth a maximum of 50 points. The teacher knows from past experience that the test scores are normally distributed with a mean score of 33 and a standard deviation of 5.5. m The typical grade scale is 45-50 is an A; 40-44 is a B; 35-39 is a C; 30-34 is a D; and 29 or less is an F. Since this exam was particularly tough, the teacher decides to curve the test scores. QUESTIONS: 1. If the professor simply adds 5 points to everyone's test score, what is the new mean? What is the new standard deviation? You must justify your answer in order to get credit for this question. Tell me what Cate me in some way that your answer is right. the new mean and standard deviation will be AND prove t list of Spes. You will not use this information anywhere else on this assignment. All other questions on this assignment will use the info in boldface print above. and the main and stound dev 2. If the grades are curved using the following parameters (instead of simply adding more points to the test), find the numerical limits for each letter grade. (For each of the following. I should see a normal distribution curve picture with shading. In addition, you should write down the calculator function that you used and what were the parameters you entered into your calculator. For instance, if you use NORMALCDF, then you should write down the lower bound, upper bound, mean, and standard deviation that you used). Your answer to this question should be a grade scale reflecting what scores would result in an A, a B, a C, a D, and an F. Top 10% (also known as the 90 percentile) Scores above the bottom 70% and below the top 10% (70 Scores above the bottom 30% and below the top 30% (30 Scores above the bottom 10% and below the top 70% (10 Bottom 10% D F. Round the scores from each letter grade to the nearest integer. AA AA percentile) percentile) percentile) trol 1. Test scores: 2 4 6 8 10 240-39-A 36-39-B 30-35 C 26-29=D 126-4F A) TOP 10% mean = 6 11 Stand: dev-2-828 13 15 40-50 36-39 30-35 - 29 Test Scores u า below 9 •mean went up stayed the 70% St 36 4. 5. 6. 7. Using the teacher's original grade scale (not your results from question number 2; use the grade scale in boldface print), if one student is selected at random, what is the probability that the test score is a 'B' or higher? (I should see a normal distribution with the appropriate area shaded. In addition, tell me what calculator function you used and what parameters you entered into the calculator in order to find your answer and what info you inputted into your calculator). What is the probability of getting 'B' or higher when you select one student at random using the 'new' grade scale from #2? (I should see a normal distribution with the appropriate area shaded. In addition, tell me what calculator function you used and what parameters you entered into the calculator in order to find your answer). Using the original grade scale (boldface grade scale) and selecting 6 students at random, what is the probability that their mean score would be an 'A'? Can the Central Limit Theorem by used in this case even though the sample is small? Why or why not? If you can use the Central Limit Theorem, I need to see the calculation you used to determine the new standard deviation. In addition, tell me what calculator function you used to determine the answer to this question as well as what parameters you entered into your calculator. Do not round your answer. In an attempt to get an estimate of the proportion of his students that generally pass his exam, the statistics professor takes a sample of his data from past classes. He finds that in a sample of 200 test scores, 135 students got a passing grade. He then calculated the following 95% confidence interval estimate based on this sample: 61% < p < 74% (a.) Write the interpretation of this confidence interval (in other words, what does it mean?). (b.) Determine the Margin of Error used in this confidence interval. Show your calculation. ecimal. Places In number 6, the professor used a sample size of 200. Assume that the sample was a simple random sample. Verify that the sample size of 200 was appropriate. Use the value of 135/200=0.675 for the sample proportion of p-hat. Show your calculation. Grading: Question 1: Question 2: Question 3: Question 4: Question 5: 10 total points 25 total points 10 total points 10 total points 15 total points Question 6: 20 total points Question 7: 10 total points -7.2 notes Points are based on completeness, following instructions, accuracy of calculations, and answers to all questions. A statistics professor gives an exam that is worth a maximum of 50 points. The teacher knows from past experience that the test scores are normally distributed with a mean score of 33 and a standard deviation of 5.5. m The typical grade scale is 45-50 is an A; 40-44 is a B; 35-39 is a C; 30-34 is a D; and 29 or less is an F. Since this exam was particularly tough, the teacher decides to curve the test scores. QUESTIONS: 1. If the professor simply adds 5 points to everyone's test score, what is the new mean? What is the new standard deviation? You must justify your answer in order to get credit for this question. Tell me what Cate me in some way that your answer is right. the new mean and standard deviation will be AND prove t list of Spes. You will not use this information anywhere else on this assignment. All other questions on this assignment will use the info in boldface print above. and the main and stound dev 2. If the grades are curved using the following parameters (instead of simply adding more points to the test), find the numerical limits for each letter grade. (For each of the following. I should see a normal distribution curve picture with shading. In addition, you should write down the calculator function that you used and what were the parameters you entered into your calculator. For instance, if you use NORMALCDF, then you should write down the lower bound, upper bound, mean, and standard deviation that you used). Your answer to this question should be a grade scale reflecting what scores would result in an A, a B, a C, a D, and an F. Top 10% (also known as the 90 percentile) Scores above the bottom 70% and below the top 10% (70 Scores above the bottom 30% and below the top 30% (30 Scores above the bottom 10% and below the top 70% (10 Bottom 10% D F. Round the scores from each letter grade to the nearest integer. AA AA percentile) percentile) percentile) trol 1. Test scores: 2 4 6 8 10 240-39-A 36-39-B 30-35 C 26-29=D 126-4F A) TOP 10% mean = 6 11 Stand: dev-2-828 13 15 40-50 36-39 30-35 - 29 Test Scores u า below 9 •mean went up stayed the 70% St 36
Expert Answer:
Answer rating: 100% (QA)
The following is the original grading scheme A 4550 B 4044 C 3539 D 3334 F 029 The mean would increase by five points if the professor gave each student an extra five points on the exam but the standa... View the full answer

Related Book For 

Posted Date:
Students also viewed these mathematics questions
-
1. For each of the variables listed in the table below, indicate: the type of variable - quantitative discrete, quantitative continuous or qualitative, and the level of measurement for the variable -...
-
3 Diversification 1. Equally Weighted Portfolio (Total 20 points) (a) Setting and notations Consider an investment universe with n securities, S1, S2, ..., Sn. Given a fixed investment horizon, we...
-
In 2007, data from two Youth Risk Behavior Surveys were analyzed to investigate seatbelt use among high school students ages 16 or older. The results were published in the September 2008 issue of...
-
GIVE ME YOUR OWN ANSWER IF YOU CAN THANK YOU!E17-21. Outsourcing (Make-or-Buy) Decision Assume a division ofHP Inc. currently makes 50,000 circuit boards per year used inproducing diagnostic electr 2...
-
Let a and b be nonparallel vectors, and let c be any nonzero vector. Show that (a b) e is a vector in the plane of a and b.
-
What is a nurses primary ethical responsibility?
-
\(\{293,7,298,19,229\}\) Find the greatest common divisor of the given set of numbers.
-
Forrest runs Y Not Flowers, Inc. (YNF), a wholesale flower distributor with stores in several major metropolitan areas of the U.S. He is considering expanding his business, but he thinks his current...
-
Med Max buys surgical supplies from a variety of manufacturers and then resells and delivers these supplies to dozens of hospitals. In the face of declining profits, Med Max decided to implement an...
-
Complete Form 941 for the 4th quarter for TCLH Industries (which is located at 202 Whitmore Avenue, Durham, NC 27701; Employer Identification #44-4444444). Assume that all necessary deposits were...
-
1)Find the present value of the following ordinary annuities . ( Notes: If you are using a financial calculator, you can enter the known values and then press the appropriate key to find the unknown...
-
Define a special report according to AU Section 623.
-
Regardless of the assessed level of control risk, an auditor would perform some a. Tests of controls to determine the effectiveness of internal controls. b. Analytical procedures to verify the design...
-
An auditor who conducts an audit in accordance with generally accepted auditing standards and concludes that the financial statements are fairly presented in accordance with a comprehensive basis of...
-
Negative assurance may be expressed when an accountant is requested to report on the a. Compilation of prospective financial statements. b. Compliance with the provisions of the Foreign Corrupt...
-
This exercise considers nursing home data provided by theWisconsin Department of Health and Family Services (DHFS).The State of Wisconsin Medicaid program funds nursing home care for individuals...
-
A close friend of yours is majoring in accounting and would like to work for Multinational companies (MNC) upon graduation. Your friend is unsure just what courses would help prepare for that goal...
-
Eleni Cabinet Company sold 2,200 cabinets during 2011 at $160 per cabinet. Its beginning inventory on January 1 was 130 cabinets at $56. Purchases made during the year were as follows: February . 225...
-
Two independent random samples of sizes 18 and 24 were obtained to make inferences about the difference between two means.What is the number of degrees of freedom? Discuss both cases.
-
An insurance company states that 90% of its claims are settled within 30 days. A consumer group selected a random sample of 75 of the companys claims to test this statement. If the consumer group...
-
When it comes to getting workers to produce, money is not everything; feeling appreciated is more important. Do the rankings assigned by workers and the boss show a significant difference in what...
-
What is the primary conceptual difference between the straight-line and effective interest methods of amortizing bond discount and premium?
-
Define extinguishment of debt.
-
When may extinguishment of debt occur? List the various ways in which extinguishment of debt occurs.

Study smarter with the SolutionInn App