

Of all the price analysis methodologies that exist, which are the foundational methods. Longing & Shorting....
Fantastic news! We've Found the answer you've been seeking!
Question:
Transcribed Image Text:
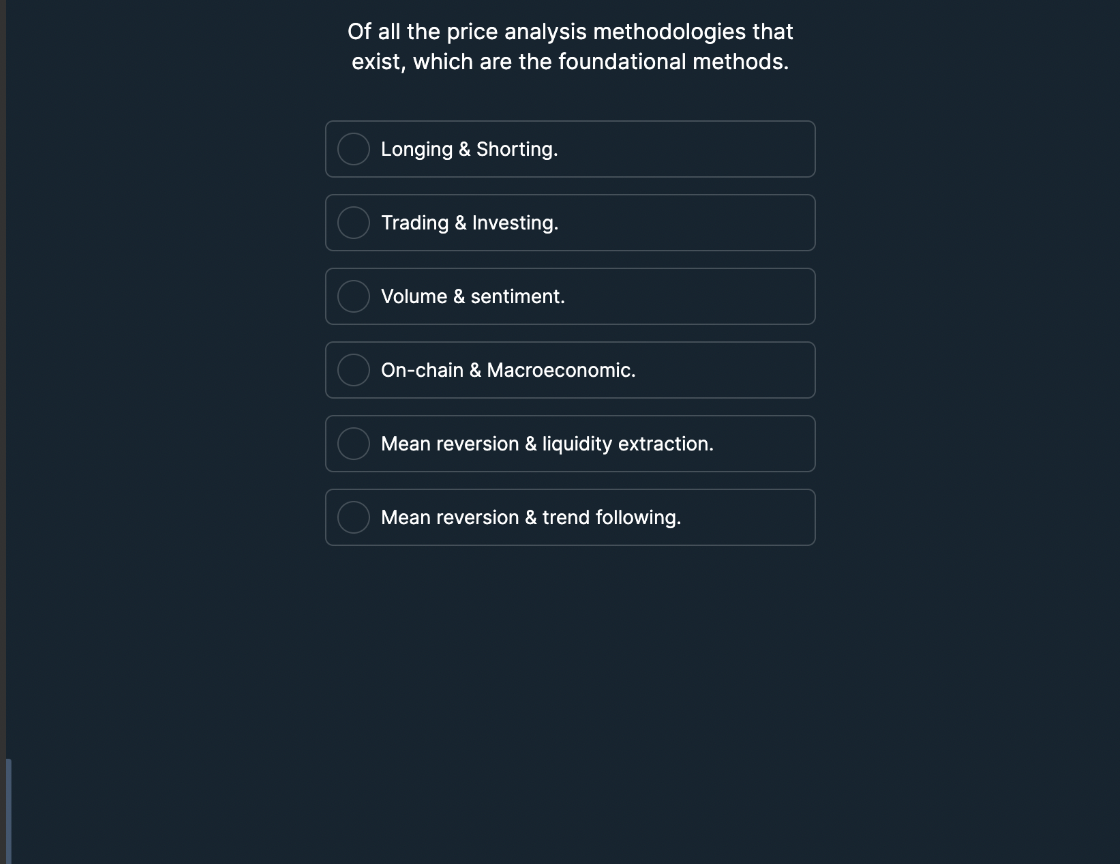
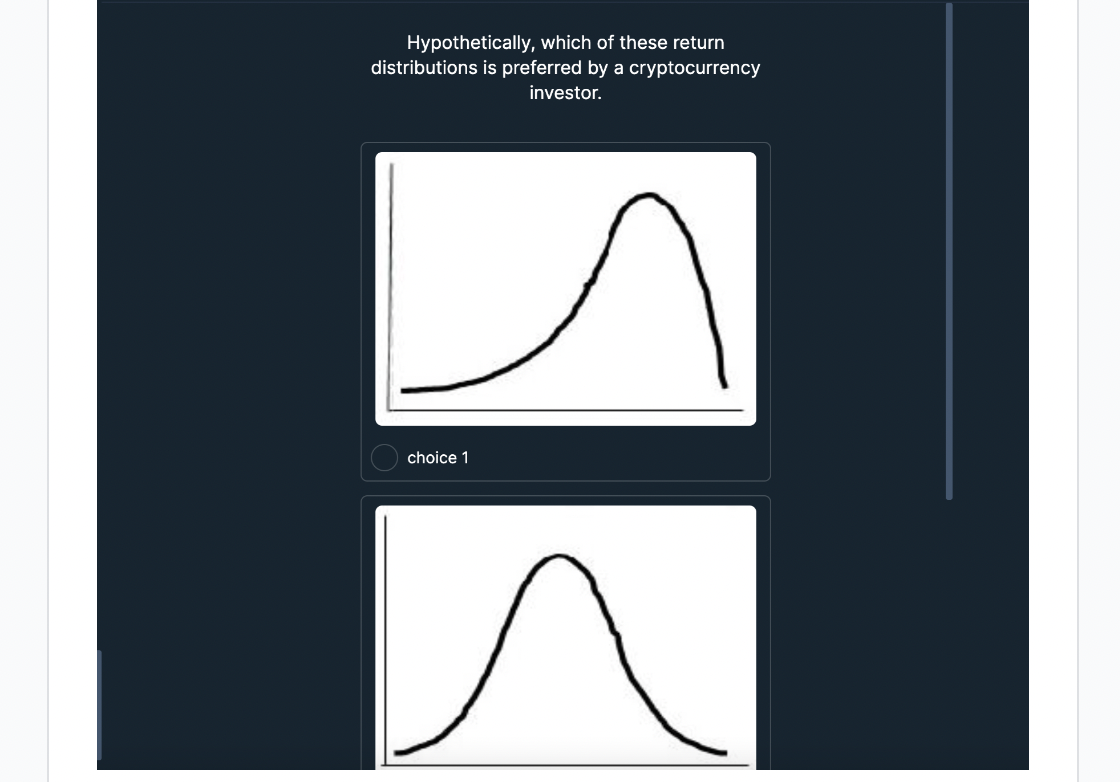
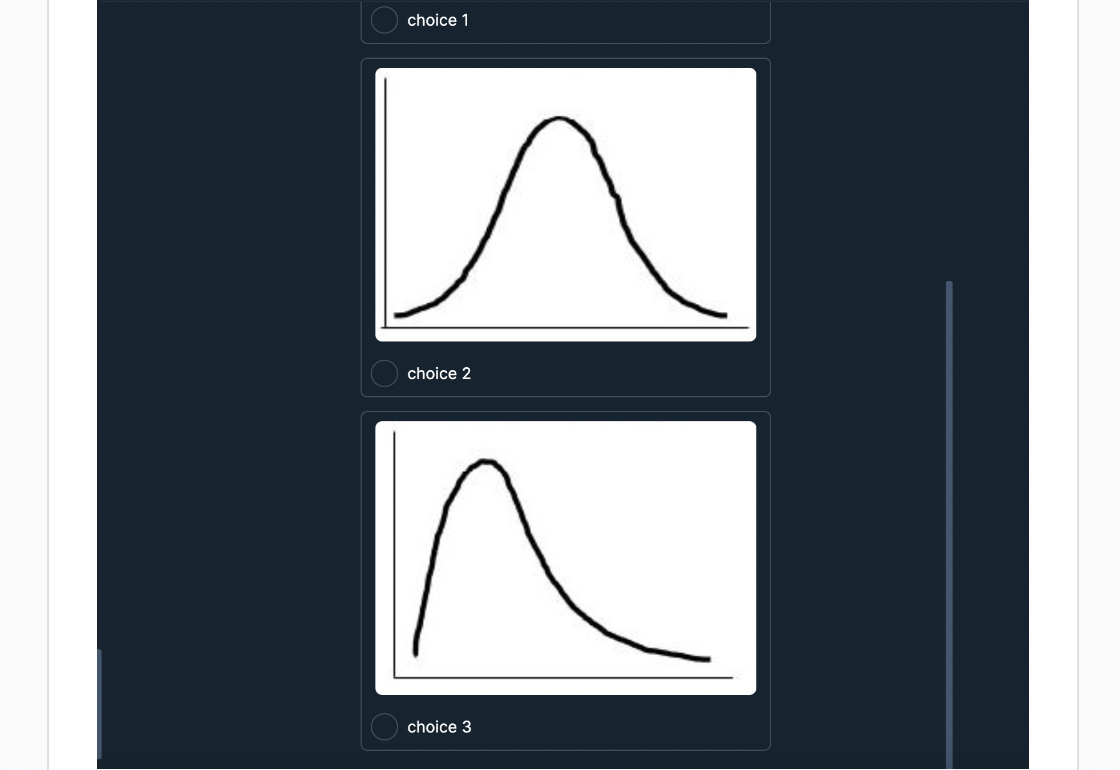
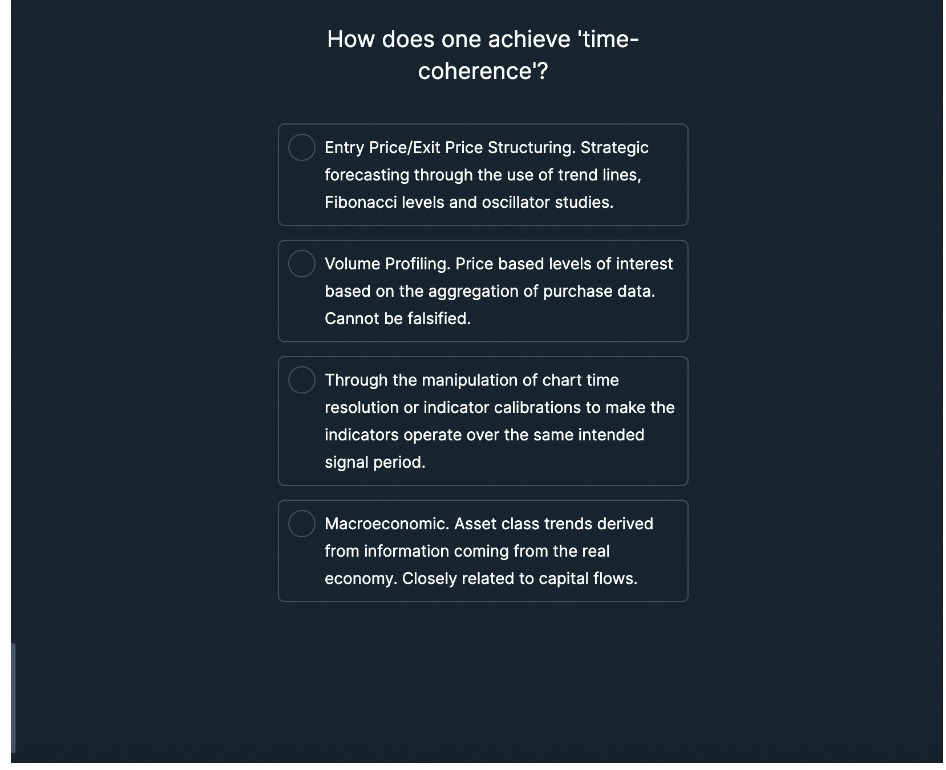
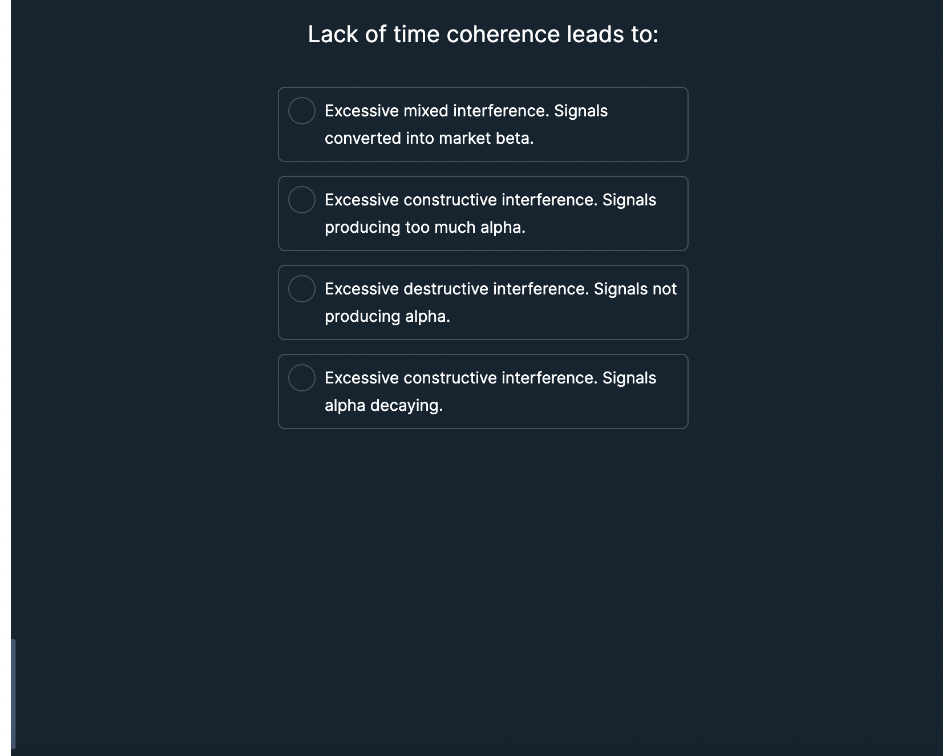
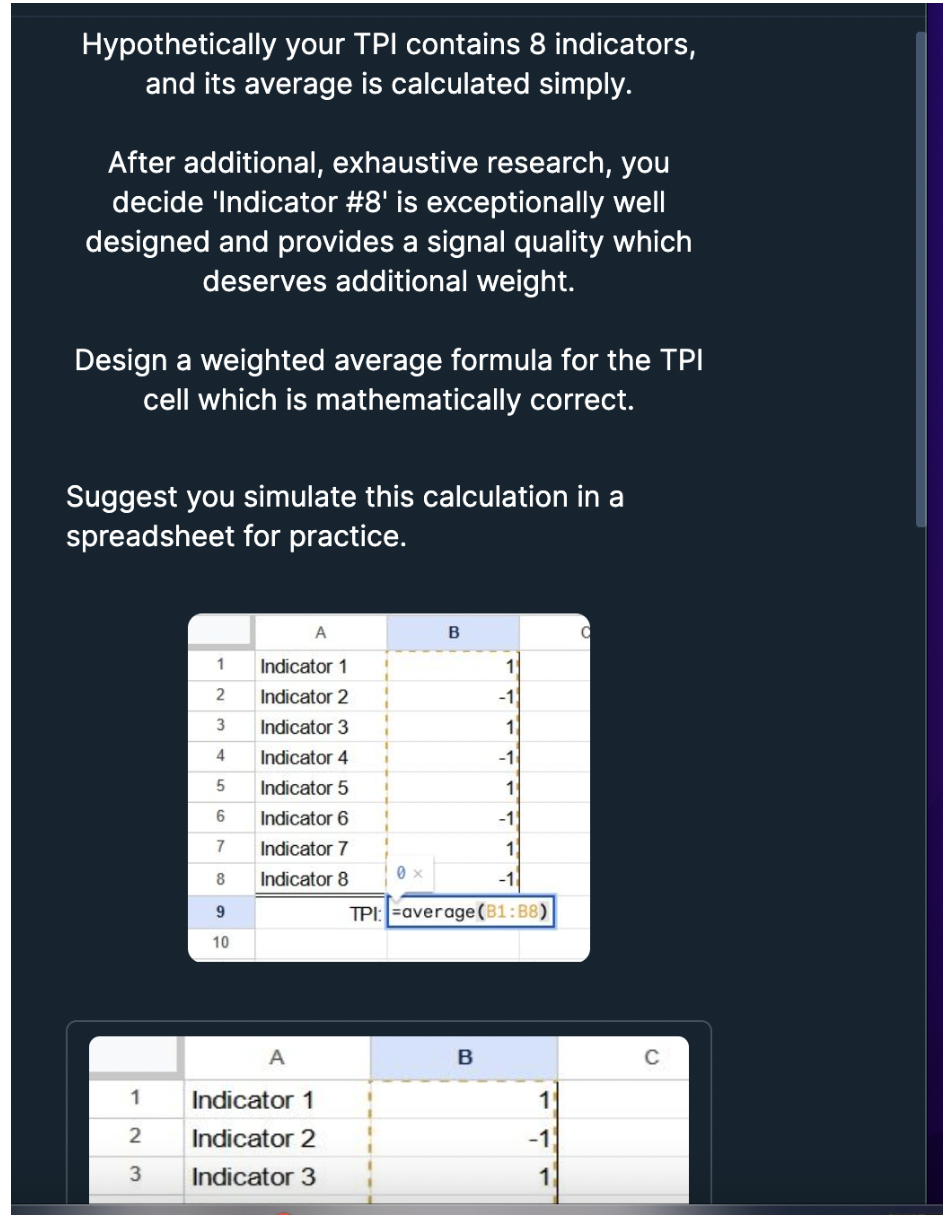
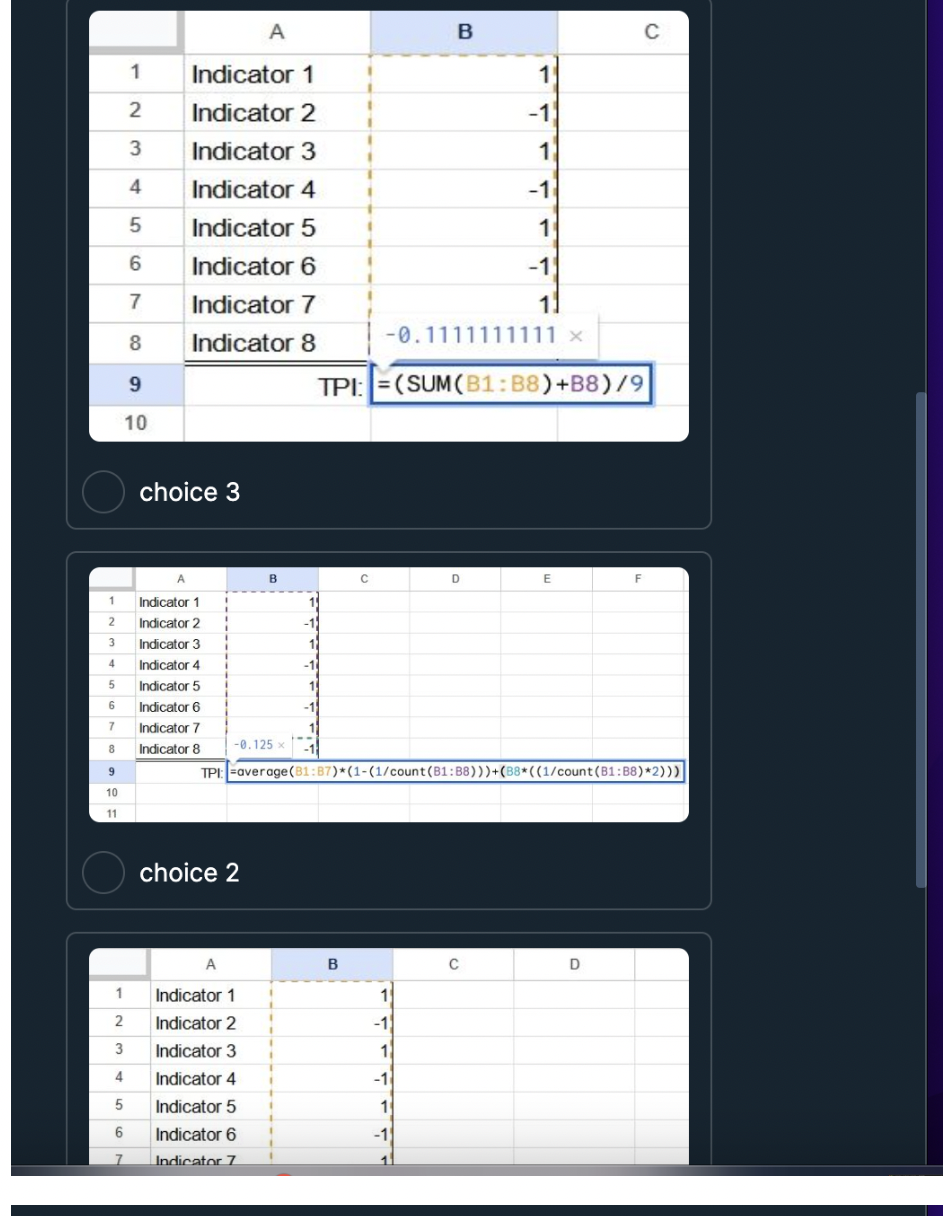
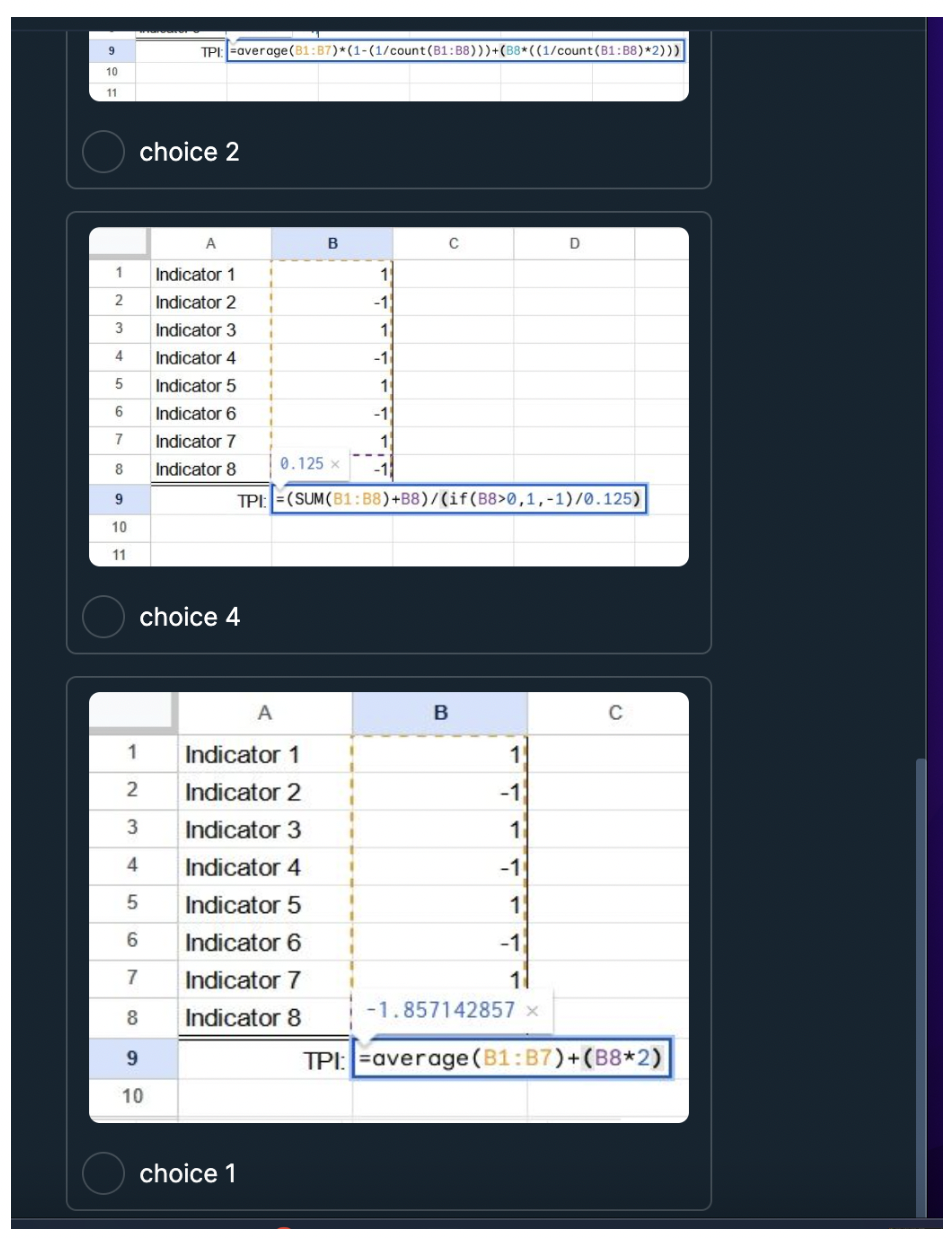
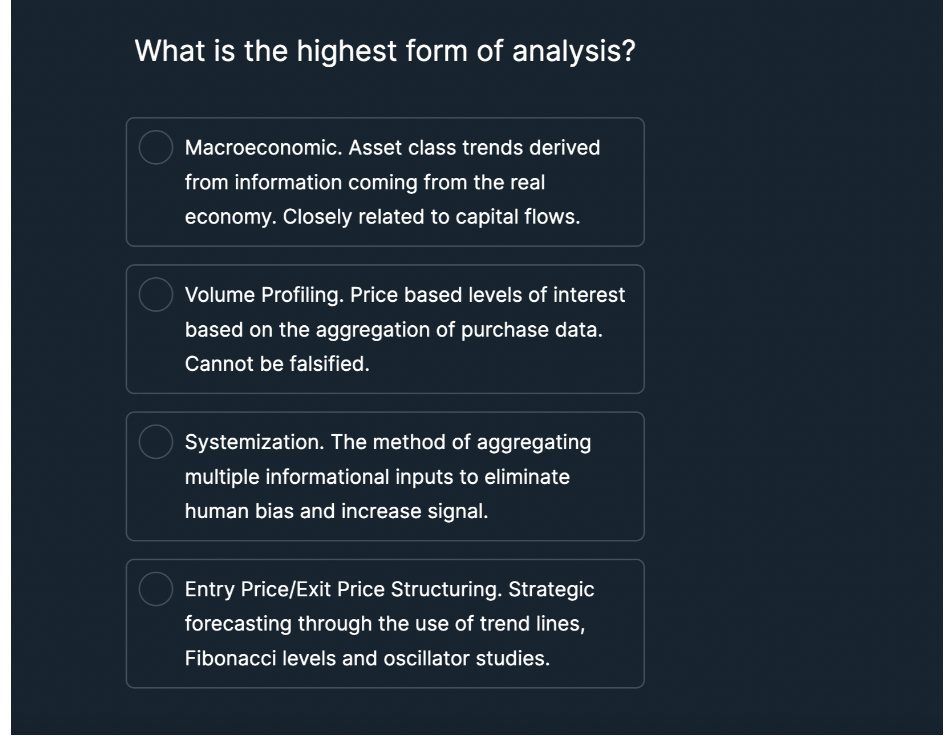
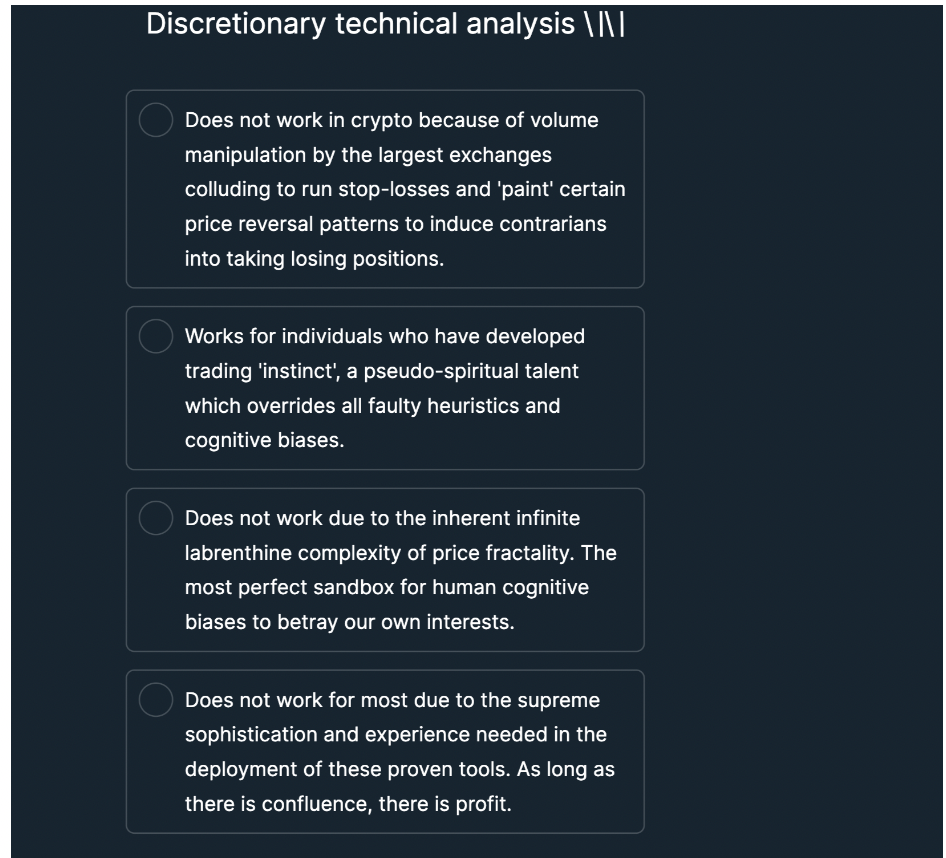
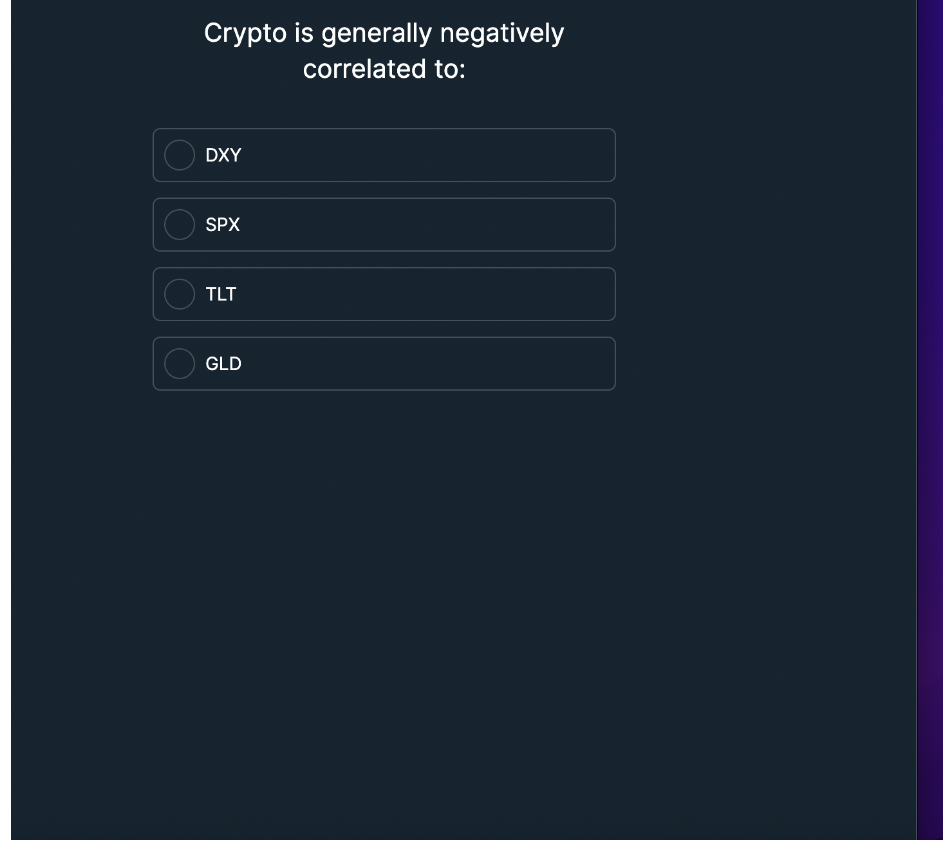
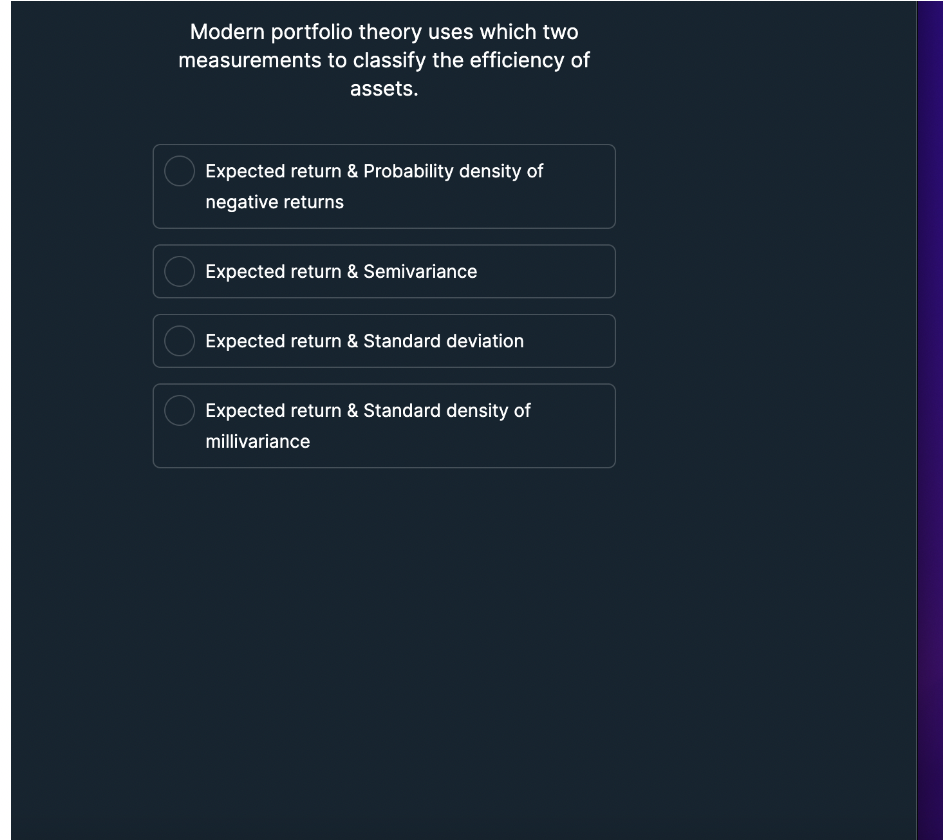
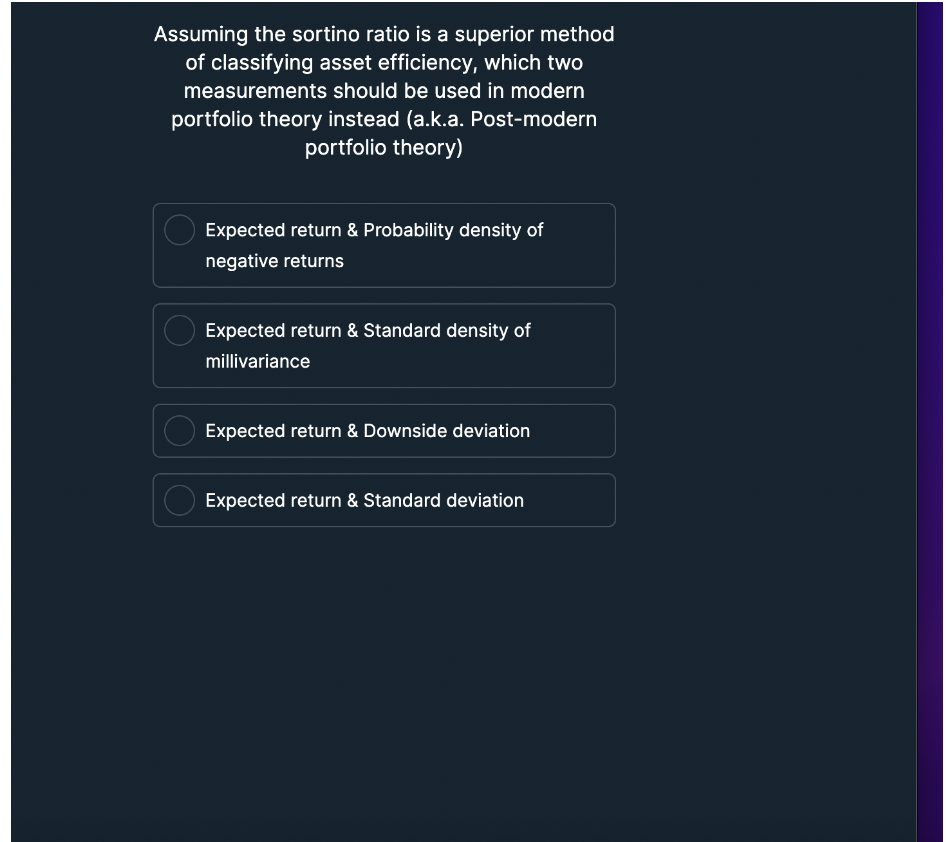
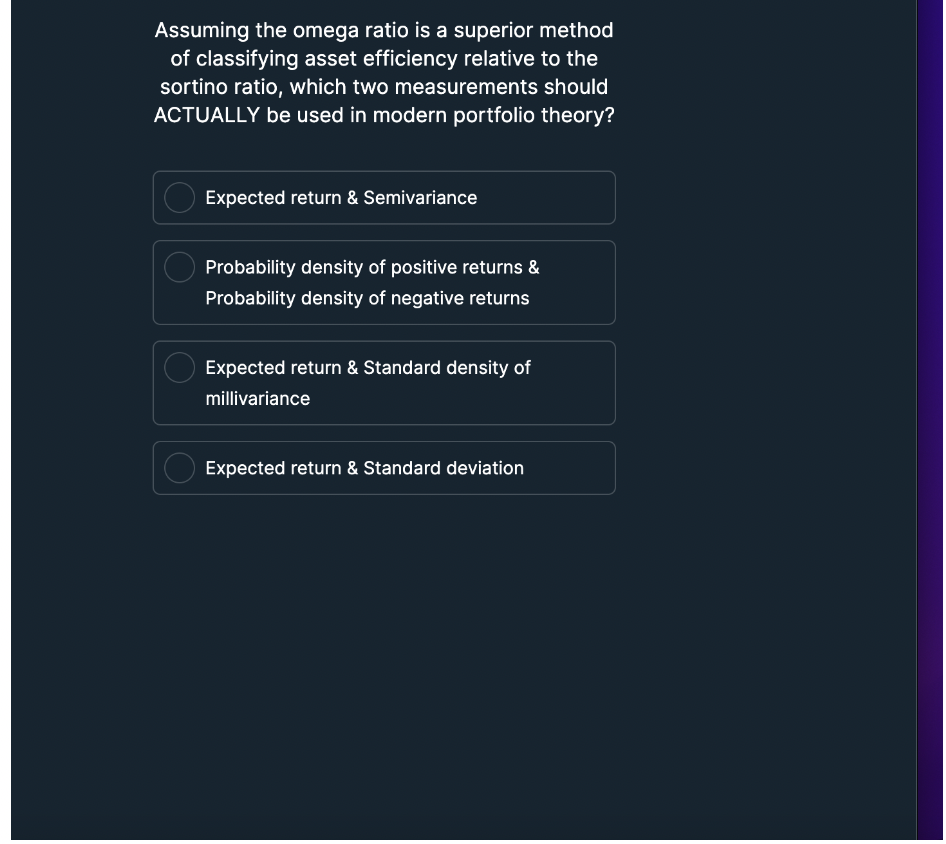
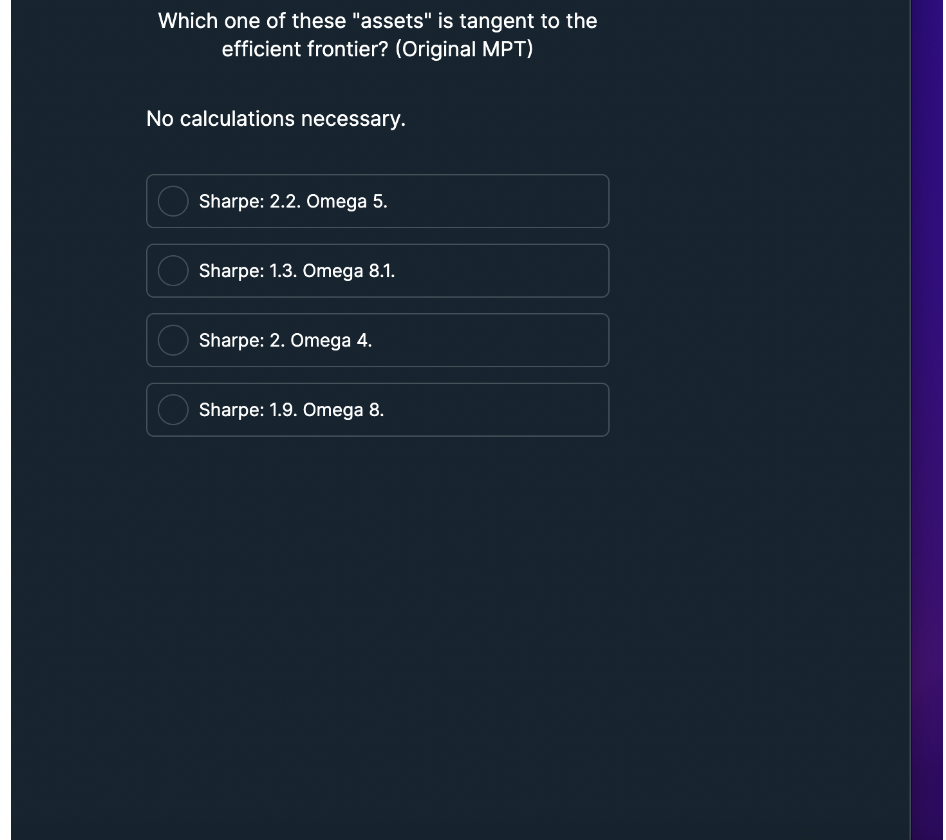
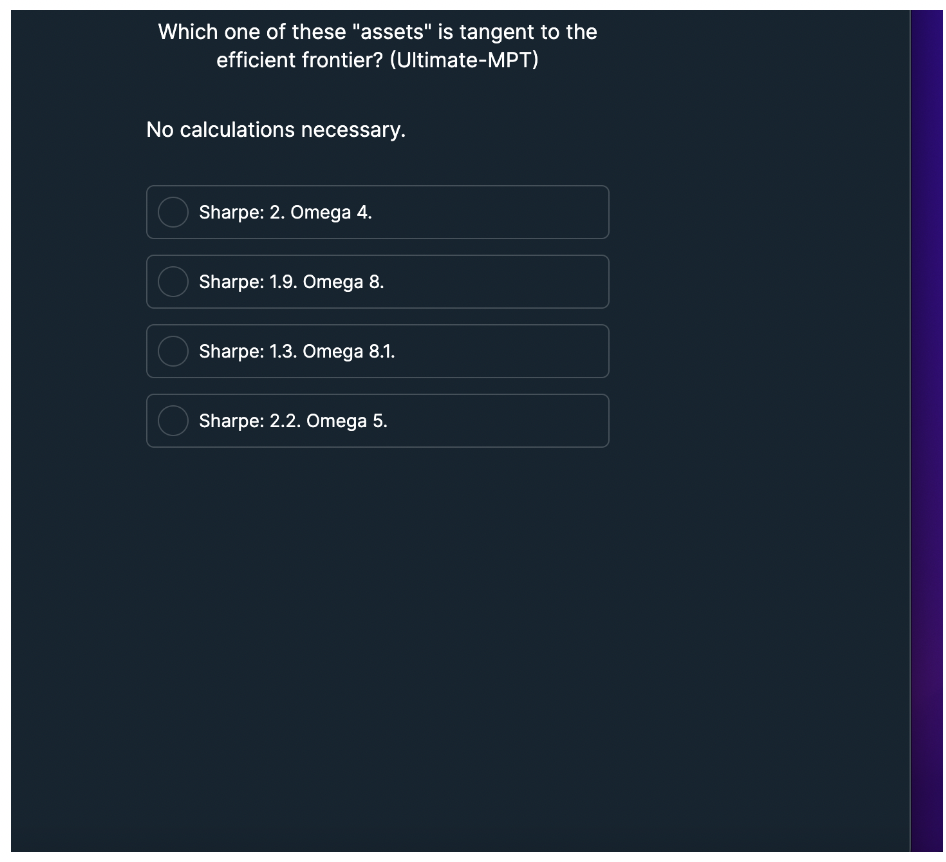
Of all the price analysis methodologies that exist, which are the foundational methods. Longing & Shorting. Trading & Investing. Volume & sentiment. On-chain & Macroeconomic. Mean reversion & liquidity extraction. Mean reversion & trend following. Hypothetically, which of these return distributions is preferred by a cryptocurrency investor. choice 1 choice 1 choice 2 choice 3 How does one achieve 'time- coherence'? Entry Price/Exit Price Structuring. Strategic forecasting through the use of trend lines, Fibonacci levels and oscillator studies. Volume Profiling. Price based levels of interest based on the aggregation of purchase data. Cannot be falsified. Through the manipulation of chart time resolution or indicator calibrations to make the indicators operate over the same intended signal period. Macroeconomic. Asset class trends derived from information coming from the real economy. Closely related to capital flows. Lack of time coherence leads to: Excessive mixed interference. Signals converted into market beta. Excessive constructive interference. Signals producing too much alpha. Excessive destructive interference. Signals not producing alpha. Excessive constructive interference. Signals alpha decaying. Hypothetically your TPI contains 8 indicators, and its average is calculated simply. After additional, exhaustive research, you decide 'Indicator #8' is exceptionally well designed and provides a signal quality which deserves additional weight. Design a weighted average formula for the TPI cell which is mathematically correct. Suggest you simulate this calculation in a spreadsheet for practice. A B 1 Indicator 1 1 2 Indicator 2 -1 3 Indicator 3 1 4 Indicator 4 -1 5 Indicator 5 1 6 Indicator 6 -1 7 Indicator 7 1 8 Indicator 8 0 × -1 9 TPI: average (B1:B8) 10 A B 1 Indicator 1 1 2 Indicator 2 -1 3 Indicator 3 11 A B 1 C 1 Indicator 1 2 Indicator 2 -1 3 Indicator 3 11 4 Indicator 4 -1 5 Indicator 5 1 6 Indicator 6 -11 7 Indicator 7 11 8 Indicator 8 9 -0.1111111111 x TPI: (SUM(B1:B8)+B8)/9 10 choice 3 B C D E F 1 Indicator 1 2 Indicator 2 3 Indicator 3 4 Indicator 4 5 Indicator 5 6 Indicator 6 7 Indicator 7 8 Indicator 8 -0.125 x 9 TPI: average (B1:B7)*(1-(1/count(B1:B8)))+(B8*((1/count(B1:B8)*2))) 10 11 choice 2 A B C D 1 Indicator 1 1 2 Indicator 2 -1 3 Indicator 3 1 4 Indicator 4 -1 5 Indicator 5 6 Indicator 6 -15 7 Indicator 7 9 TPI: average (B1:B7)* (1-(1/count(B1:B8)))+(B8*((1/count(B1:B8)*2))) 10 11 choice 2 A B C D 1 Indicator 1 1 2 Indicator 2 -1 3 Indicator 3 1 4 Indicator 4 -1 5 Indicator 5 1 6 Indicator 6 -1 7 Indicator 7 8 Indicator 8 0.125 x 9 TPI: (SUM(B1:B8)+B8)/(if (B8>0,1,-1)/0.125) 10 11 choice 4 A B C 1 Indicator 1 1 23456 Indicator 2 Indicator 3 -1 1 Indicator 4 -10 Indicator 5 1 Indicator 6 -1 1 7 Indicator 7 8 Indicator 8 9 10 -1.857142857 × TPI: average (B1:B7)+(B8*2) choice 1 What is the highest form of analysis? Macroeconomic. Asset class trends derived from information coming from the real economy. Closely related to capital flows. Volume Profiling. Price based levels of interest based on the aggregation of purchase data. Cannot be falsified. Systemization. The method of aggregating multiple informational inputs to eliminate human bias and increase signal. Entry Price/Exit Price Structuring. Strategic forecasting through the use of trend lines, Fibonacci levels and oscillator studies. Discretionary technical analysis \|\| Does not work in crypto because of volume manipulation by the largest exchanges colluding to run stop-losses and 'paint' certain price reversal patterns to induce contrarians into taking losing positions. Works for individuals who have developed trading 'instinct', a pseudo-spiritual talent which overrides all faulty heuristics and cognitive biases. Does not work due to the inherent infinite labrenthine complexity of price fractality. The most perfect sandbox for human cognitive biases to betray our own interests. Does not work for most due to the supreme sophistication and experience needed in the deployment of these proven tools. As long as there is confluence, there is profit. High crypto market correlation... Incentivizes broad diversification Incentivizes narrow diversification Renders broad diversification useless Renders narrow diversification useless Crypto is generally positively correlated to: TLT SPX GLD DXY Crypto is generally negatively correlated to: DXY SPX TLT GLD Modern portfolio theory uses which two measurements to classify the efficiency of assets. Expected return & Probability density of negative returns Expected return & Semivariance Expected return & Standard deviation Expected return & Standard density of millivariance Assuming the sortino ratio is a superior method of classifying asset efficiency, which two measurements should be used in modern portfolio theory instead (a.k.a. Post-modern portfolio theory) Expected return & Probability density of negative returns Expected return & Standard density of millivariance Expected return & Downside deviation Expected return & Standard deviation Assuming the omega ratio is a superior method of classifying asset efficiency relative to the sortino ratio, which two measurements should ACTUALLY be used in modern portfolio theory? Expected return & Semivariance Probability density of positive returns & Probability density of negative returns Expected return & Standard density of millivariance Expected return & Standard deviation Which one of these "assets" is tangent to the efficient frontier? (Original MPT) No calculations necessary. Sharpe: 2.2. Omega 5. Sharpe: 1.3. Omega 8.1. Sharpe: 2. Omega 4. Sharpe: 1.9. Omega 8. Which one of these "assets" is tangent to the efficient frontier? (Ultimate-MPT) No calculations necessary. Sharpe: 2. Omega 4. Sharpe: 1.9. Omega 8. Sharpe: 1.3. Omega 8.1. Sharpe: 2.2. Omega 5. Of all the price analysis methodologies that exist, which are the foundational methods. Longing & Shorting. Trading & Investing. Volume & sentiment. On-chain & Macroeconomic. Mean reversion & liquidity extraction. Mean reversion & trend following. Hypothetically, which of these return distributions is preferred by a cryptocurrency investor. choice 1 choice 1 choice 2 choice 3 How does one achieve 'time- coherence'? Entry Price/Exit Price Structuring. Strategic forecasting through the use of trend lines, Fibonacci levels and oscillator studies. Volume Profiling. Price based levels of interest based on the aggregation of purchase data. Cannot be falsified. Through the manipulation of chart time resolution or indicator calibrations to make the indicators operate over the same intended signal period. Macroeconomic. Asset class trends derived from information coming from the real economy. Closely related to capital flows. Lack of time coherence leads to: Excessive mixed interference. Signals converted into market beta. Excessive constructive interference. Signals producing too much alpha. Excessive destructive interference. Signals not producing alpha. Excessive constructive interference. Signals alpha decaying. Hypothetically your TPI contains 8 indicators, and its average is calculated simply. After additional, exhaustive research, you decide 'Indicator #8' is exceptionally well designed and provides a signal quality which deserves additional weight. Design a weighted average formula for the TPI cell which is mathematically correct. Suggest you simulate this calculation in a spreadsheet for practice. A B 1 Indicator 1 1 2 Indicator 2 -1 3 Indicator 3 1 4 Indicator 4 -1 5 Indicator 5 1 6 Indicator 6 -1 7 Indicator 7 1 8 Indicator 8 0 × -1 9 TPI: average (B1:B8) 10 A B 1 Indicator 1 1 2 Indicator 2 -1 3 Indicator 3 11 A B 1 C 1 Indicator 1 2 Indicator 2 -1 3 Indicator 3 11 4 Indicator 4 -1 5 Indicator 5 1 6 Indicator 6 -11 7 Indicator 7 11 8 Indicator 8 9 -0.1111111111 x TPI: (SUM(B1:B8)+B8)/9 10 choice 3 B C D E F 1 Indicator 1 2 Indicator 2 3 Indicator 3 4 Indicator 4 5 Indicator 5 6 Indicator 6 7 Indicator 7 8 Indicator 8 -0.125 x 9 TPI: average (B1:B7)*(1-(1/count(B1:B8)))+(B8*((1/count(B1:B8)*2))) 10 11 choice 2 A B C D 1 Indicator 1 1 2 Indicator 2 -1 3 Indicator 3 1 4 Indicator 4 -1 5 Indicator 5 6 Indicator 6 -15 7 Indicator 7 9 TPI: average (B1:B7)* (1-(1/count(B1:B8)))+(B8*((1/count(B1:B8)*2))) 10 11 choice 2 A B C D 1 Indicator 1 1 2 Indicator 2 -1 3 Indicator 3 1 4 Indicator 4 -1 5 Indicator 5 1 6 Indicator 6 -1 7 Indicator 7 8 Indicator 8 0.125 x 9 TPI: (SUM(B1:B8)+B8)/(if (B8>0,1,-1)/0.125) 10 11 choice 4 A B C 1 Indicator 1 1 23456 Indicator 2 Indicator 3 -1 1 Indicator 4 -10 Indicator 5 1 Indicator 6 -1 1 7 Indicator 7 8 Indicator 8 9 10 -1.857142857 × TPI: average (B1:B7)+(B8*2) choice 1 What is the highest form of analysis? Macroeconomic. Asset class trends derived from information coming from the real economy. Closely related to capital flows. Volume Profiling. Price based levels of interest based on the aggregation of purchase data. Cannot be falsified. Systemization. The method of aggregating multiple informational inputs to eliminate human bias and increase signal. Entry Price/Exit Price Structuring. Strategic forecasting through the use of trend lines, Fibonacci levels and oscillator studies. Discretionary technical analysis \|\| Does not work in crypto because of volume manipulation by the largest exchanges colluding to run stop-losses and 'paint' certain price reversal patterns to induce contrarians into taking losing positions. Works for individuals who have developed trading 'instinct', a pseudo-spiritual talent which overrides all faulty heuristics and cognitive biases. Does not work due to the inherent infinite labrenthine complexity of price fractality. The most perfect sandbox for human cognitive biases to betray our own interests. Does not work for most due to the supreme sophistication and experience needed in the deployment of these proven tools. As long as there is confluence, there is profit. High crypto market correlation... Incentivizes broad diversification Incentivizes narrow diversification Renders broad diversification useless Renders narrow diversification useless Crypto is generally positively correlated to: TLT SPX GLD DXY Crypto is generally negatively correlated to: DXY SPX TLT GLD Modern portfolio theory uses which two measurements to classify the efficiency of assets. Expected return & Probability density of negative returns Expected return & Semivariance Expected return & Standard deviation Expected return & Standard density of millivariance Assuming the sortino ratio is a superior method of classifying asset efficiency, which two measurements should be used in modern portfolio theory instead (a.k.a. Post-modern portfolio theory) Expected return & Probability density of negative returns Expected return & Standard density of millivariance Expected return & Downside deviation Expected return & Standard deviation Assuming the omega ratio is a superior method of classifying asset efficiency relative to the sortino ratio, which two measurements should ACTUALLY be used in modern portfolio theory? Expected return & Semivariance Probability density of positive returns & Probability density of negative returns Expected return & Standard density of millivariance Expected return & Standard deviation Which one of these "assets" is tangent to the efficient frontier? (Original MPT) No calculations necessary. Sharpe: 2.2. Omega 5. Sharpe: 1.3. Omega 8.1. Sharpe: 2. Omega 4. Sharpe: 1.9. Omega 8. Which one of these "assets" is tangent to the efficient frontier? (Ultimate-MPT) No calculations necessary. Sharpe: 2. Omega 4. Sharpe: 1.9. Omega 8. Sharpe: 1.3. Omega 8.1. Sharpe: 2.2. Omega 5.
Expert Answer:
Answer rating: 100% (QA)
Lets break down and answer each question 1 Foundational Price Analysis Methodologies Longing Shorting Trading Investing Volume sentiment Onchain Macro... View the full answer

Related Book For 

Posted Date:
Students also viewed these finance questions
-
. Classify the following series: a. 7, 9, 11, 13...... b. n+2, 2n-4, 4n+8.........
-
Correlation and Regression Analyses 1. The table below shows the time in hours spent by 6 students playing playdoh and the scores of these students got on a math test. Solve for the Pearson Product...
-
A cash flow is payable continuously at a rate of p, per annum at time t provided a life who is aged x at time 0 is still alive. I is a random variable T which measures the complete future lifetime in...
-
This case will enable you to practice conducting planning and substantive analytical procedures for accounts in the revenue cycle. When analyzing the financial data, you may assume that the 2015...
-
When asked to select their favorite opera work, 26% of the respondents selected a piece by Puccini, and 22% of the respondents selected a piece by Verdi. Moreover, 59% of the respondents who selected...
-
Solve -5 cos(x) = 0 for all solutions. T= where k is any integer Preview
-
Customer relationship management systems hold great promise, but their usefulness is determined by the amount of personal data customers are willing to divulge. To what extent do you think concerns...
-
At the end of 2010, Fulhage Company reported taxable income of $9,000 and pretax financial income of $10,600. The difference is due to depreciation for tax purposes in excess of depreciation for...
-
If a person is given $1 and invests that $1 for 100 years at 5%, what amount would they be able to withdraw from this account after the 100-year period?
-
Consider the situation where you just received $10,000 pre-tax income this year and you are considering whether you should contribute part of the money to IRA or an annuity account, or just put the...
-
3. Let the F(K, N) = KaN-a with a (0, 1): (a) Take the first, second, and cross derivative of F(K, N). Explain what the sign of each one means. 2 (b) Divide the function by N and show that the...
-
In a cache and memory system with the following characteristics: Direct Mapped 16 KByte 32 Byte Cache Lines (Blocks) 32 bit addresses, byte addressable How many bits are the Tag, Index and Offset...
-
Lakeside Incorporated manufactures four lines of remote control boats and uses activity-based costing to calculate product cost. Activity Pools Machining Setup Quality control Estimated Total Cost $...
-
b) Explain what decision-making is (no more than 50 words for each) i) according to the legal context of Anishinaabe nations ii) according to the context of CPA professional standards quoted from...
-
C elestial products, inc., has decided to introduce a new product, which can be manufactured by either a computer - assisted manufacturing system or a labor - intensive production system. the...
-
Prepare an Income Statement using Variable Costing, based on the following data: Direct Materials, $30,000; Direct Labor, $40,000; Variable Factory Overhead, $20,000; Fixed Factory Overhead; $50,000;...
-
What do these data suggest about the damage caused to human cells by the toxin and by the enzyme that neutralises acid?
-
The first national bank pays a 4% interest rate compound continuously. The effective annual rate paid by the bank is __________. a. 4.16% b. 4.20% c. 4.08% d. 4.12%
-
Data You are employed as the assistant management accountant in the group accountant's office of Hampstead plc. Hampstead recently acquired Finchley Ltd, a small company making a specialist product...
-
You are the management accountant of a publishing and printing company which has been asked to quote for the production of a programmer for the local village fair. The work would be carried out in...
-
G Limited, manufacturers of superior garden ornaments, is preparing its production budget for the coming period. The company makes four types of ornament, the data for which are as follows: Fixed...
-
What does a rate earned on average stockholders' equity show?
-
What two major guides do businesses use to determine acceptable levels of performance?
-
What does an accounts receivable turnover ratio of 9.1 indicate?

Study smarter with the SolutionInn App