

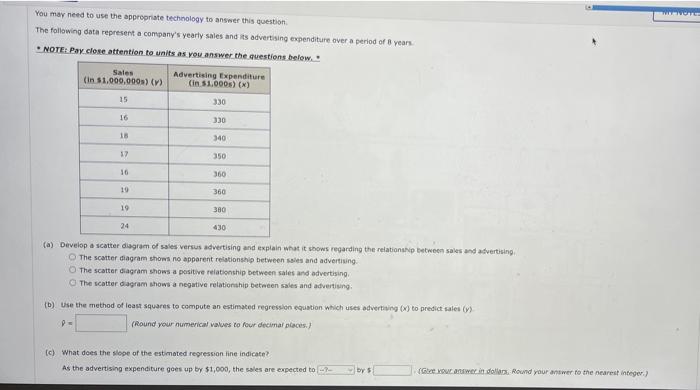
You may need to use the appropriate technology to answer this question. The following data represent...
Fantastic news! We've Found the answer you've been seeking!
Question:

Transcribed Image Text:
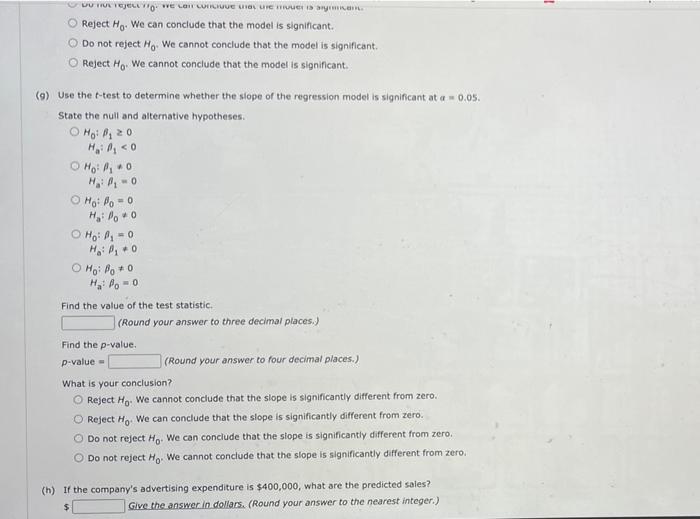
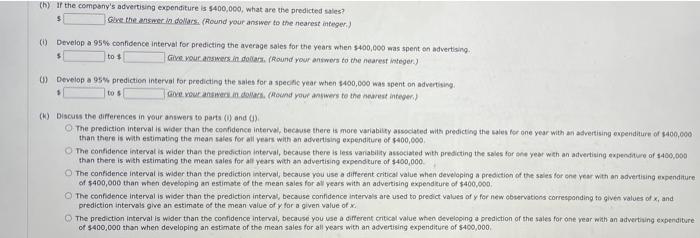
You may need to use the appropriate technology to answer this question. The following data represent a company's yearly sales and its advertising expenditure over a period of 8 years NOTE: Pay close attention to units as you answer the questions below. Sales (in $1,000,000s) (v) 15 16 18 16 19 19 24 Advertising Expenditure (in $1.000s) (x) 330 330 340 350 360 360 380 430 (a) Develop a scatter diagram of sales versus advertising and explain what it shows regarding the relationship between sales and advertising. The scatter diagram shows no apparent relationship between sales and advertising. O The scatter diagram shows a positive relationship between sales and advertising. The scatter diagram shows a negative relationship between sales and advertising. (b) Use the method of least squares to compute an estimated regression equation which uses advertising (x) to predict sales (y) P= (Round your numerical values to four decimal places) (c) What does the slope of the estimated regression line indicate? As the advertising expenditure goes up by $1,000, the sales are expected to by s (Give your answer in dollars, Round your answer to the nearest integer.) THE TOTES (d) Compute the coefficient of determination. (Round your answer to four decimal places) Fully interpret its meaning. (Give your answer as a percent. Round your answer to two decimal places) The value of the coefficient of determination tells us that (e) Compute the correlation coefficient. (Round your answer to four decimal places) (f) Use the F-test to determine whether or not the regression model is significant at a -0.05. State the null and alternative hypotheses. ⒸHO:₂0 H: 0 ⒸH₂:₂=0 H₂: ₂0 Ho: Po=0 H₂:0 ⒸHg² By zo H₂: A₁ <0 ⒸHOO Halo-o Find the value of the test statistic. (Round your answer to two decimal places) Find the p-value. p-value= (Round your answer to three decimal places) What is your conclusion? Do not reject Ho We can conclude that the model is significant. O Reject Ho. We can conclude that the model is significant. Beach Club Garde Autumn Communi % of the variability in 7 has been explained by the least squares line. Check out 2022 5 DU TRUL TEJELLTO E LOIT CUIUue unas une nouer is anymian O Reject Ho. We can conclude that the model is significant. Do not reject Ho. We cannot conclude that the model is significant. O Reject Ho. We cannot conclude that the model is significant. (9) Use the f-test to determine whether the slope of the regression model is significant at a = 0.05. State the null and alternative hypotheses. Hoi A₁ 20 H₂: A₁ <0 Ho: P₁0 H₂:₁0 Ho: Po=0 H₂: Do 0 Ho: ₁0 Ho: P₁0 O Ho: Po * 0 H₂: Po=0 Find the value of the test statistic. (Round your answer to three decimal places.) Find the p-value. p-value= (Round your answer to four decimal places.) What is your conclusion? O Reject Ho. We cannot conclude that the slope is significantly different from zero. O Reject Ho. We can conclude that the slope is significantly different from zero. Do not reject Ho. We can conclude that the slope is significantly different from zero. O Do not reject Ho. We cannot conclude that the slope is significantly different from zero. (h) If the company's advertising expenditure is $400,000, what are the predicted sales? Give the answer in dollars. (Round your answer to the nearest integer.) $ (h) If the company's advertising expenditure is $400,000, what are the predicted sales? Give the answer in dollars. (Round your answer to the nearest integer.) (1) Develop a 95% confidence interval for predicting the average sales for the years when $400,000 was spent on advertising. Give your answers in dollars. (Round your answers to the nearest integer.) to $ (1) Develop a 95% prediction interval for predicting the sales for a specific year when $400,000 was spent on advertising. Give your answers in dollars. (Round your answers to the nearest integer.) to $ (K) Discuss the differences in your answers to parts (1) and (3) O The prediction interval is wider than the confidence interval, because there is more variability associated with predicting the sales for one year with an advertising expenditure of $400,000 than there is with estimating the mean sales for all years with an advertising expenditure of $400,000 The confidence interval is wider than the prediction interval, because there is less variability associated with predicting the sales for one year with an advertising expenditure of $400,000 than there is with estimating the mean sales for all years with an advertising expenditure of $400,000. O The confidence interval is wider than the prediction interval, because you use a different critical value when developing a prediction of the sales for one year with an advertising expenditure of $400,000 than when developing an estimate of the mean sales for all years with an advertising expenditure of $400,000. The confidence interval is wider than the prediction interval, because confidence intervals are used to predict values of y for new observations corresponding to given values of x, and prediction intervals give an estimate of the mean value of y for a given value of x. The prediction interval is wider than the confidence interval, because you use a different critical value when developing a prediction of the sales for one year with an advertising expenditure of $400,000 than when developing an estimate of the mean sales for all years with an advertising expenditure of $400,000. You may need to use the appropriate technology to answer this question. The following data represent a company's yearly sales and its advertising expenditure over a period of 8 years NOTE: Pay close attention to units as you answer the questions below. Sales (in $1,000,000s) (v) 15 16 18 16 19 19 24 Advertising Expenditure (in $1.000s) (x) 330 330 340 350 360 360 380 430 (a) Develop a scatter diagram of sales versus advertising and explain what it shows regarding the relationship between sales and advertising. The scatter diagram shows no apparent relationship between sales and advertising. O The scatter diagram shows a positive relationship between sales and advertising. The scatter diagram shows a negative relationship between sales and advertising. (b) Use the method of least squares to compute an estimated regression equation which uses advertising (x) to predict sales (y) P= (Round your numerical values to four decimal places) (c) What does the slope of the estimated regression line indicate? As the advertising expenditure goes up by $1,000, the sales are expected to by s (Give your answer in dollars, Round your answer to the nearest integer.) THE TOTES (d) Compute the coefficient of determination. (Round your answer to four decimal places) Fully interpret its meaning. (Give your answer as a percent. Round your answer to two decimal places) The value of the coefficient of determination tells us that (e) Compute the correlation coefficient. (Round your answer to four decimal places) (f) Use the F-test to determine whether or not the regression model is significant at a -0.05. State the null and alternative hypotheses. ⒸHO:₂0 H: 0 ⒸH₂:₂=0 H₂: ₂0 Ho: Po=0 H₂:0 ⒸHg² By zo H₂: A₁ <0 ⒸHOO Halo-o Find the value of the test statistic. (Round your answer to two decimal places) Find the p-value. p-value= (Round your answer to three decimal places) What is your conclusion? Do not reject Ho We can conclude that the model is significant. O Reject Ho. We can conclude that the model is significant. Beach Club Garde Autumn Communi % of the variability in 7 has been explained by the least squares line. Check out 2022 5 DU TRUL TEJELLTO E LOIT CUIUue unas une nouer is anymian O Reject Ho. We can conclude that the model is significant. Do not reject Ho. We cannot conclude that the model is significant. O Reject Ho. We cannot conclude that the model is significant. (9) Use the f-test to determine whether the slope of the regression model is significant at a = 0.05. State the null and alternative hypotheses. Hoi A₁ 20 H₂: A₁ <0 Ho: P₁0 H₂:₁0 Ho: Po=0 H₂: Do 0 Ho: ₁0 Ho: P₁0 O Ho: Po * 0 H₂: Po=0 Find the value of the test statistic. (Round your answer to three decimal places.) Find the p-value. p-value= (Round your answer to four decimal places.) What is your conclusion? O Reject Ho. We cannot conclude that the slope is significantly different from zero. O Reject Ho. We can conclude that the slope is significantly different from zero. Do not reject Ho. We can conclude that the slope is significantly different from zero. O Do not reject Ho. We cannot conclude that the slope is significantly different from zero. (h) If the company's advertising expenditure is $400,000, what are the predicted sales? Give the answer in dollars. (Round your answer to the nearest integer.) $ (h) If the company's advertising expenditure is $400,000, what are the predicted sales? Give the answer in dollars. (Round your answer to the nearest integer.) (1) Develop a 95% confidence interval for predicting the average sales for the years when $400,000 was spent on advertising. Give your answers in dollars. (Round your answers to the nearest integer.) to $ (1) Develop a 95% prediction interval for predicting the sales for a specific year when $400,000 was spent on advertising. Give your answers in dollars. (Round your answers to the nearest integer.) to $ (K) Discuss the differences in your answers to parts (1) and (3) O The prediction interval is wider than the confidence interval, because there is more variability associated with predicting the sales for one year with an advertising expenditure of $400,000 than there is with estimating the mean sales for all years with an advertising expenditure of $400,000 The confidence interval is wider than the prediction interval, because there is less variability associated with predicting the sales for one year with an advertising expenditure of $400,000 than there is with estimating the mean sales for all years with an advertising expenditure of $400,000. O The confidence interval is wider than the prediction interval, because you use a different critical value when developing a prediction of the sales for one year with an advertising expenditure of $400,000 than when developing an estimate of the mean sales for all years with an advertising expenditure of $400,000. The confidence interval is wider than the prediction interval, because confidence intervals are used to predict values of y for new observations corresponding to given values of x, and prediction intervals give an estimate of the mean value of y for a given value of x. The prediction interval is wider than the confidence interval, because you use a different critical value when developing a prediction of the sales for one year with an advertising expenditure of $400,000 than when developing an estimate of the mean sales for all years with an advertising expenditure of $400,000.
Expert Answer:
Answer rating: 100% (QA)
To analyze the given data set representing a companys yearly sales and advertising expenditure we will perform the following calculations and statisti... View the full answer

Related Book For 
Posted Date:
Students also viewed these mathematics questions
-
You may need to use the appropriate appendix table or technology to answer this question. A report states that adults 18- to 24- years-old send and recelve 128 texts every day. Suppose we take a...
-
You may need to use the appropriate appendix table or technology to answer this question. The increasing annual cost (including tuition, room, board, books, and fees) to attend college has been...
-
Explain why the auditors may need to use the work of a specialist in the audit of goodwill.
-
Question 1 Not yet answered Paints out of 1.00 P Flag question Question 2 Not yet answered Paints out of 1.00 P Flag question A project has the following activities, with specified precedents and...
-
The Eclipse Video Store Co. is owned and operated by Jared Helms. The following is an excerpt from a conversation between Jared Helms and Allison Fain, the chief accountant for The Eclipse Video...
-
What is an attitude? Why do businesses place so much emphasis on measuring attitudinal concepts?
-
On January 1, 2016, the U.K. subsidiary of U.S. International Corporation had the following condensed balance sheet, in pounds sterling (in millions): The exchange rate on January 1, 2016 was...
-
A company is trying to determine how to allocate its $145,000 advertising budget for a new product. The company is considering newspaper ads and television commercials as its primary means for...
-
is the repair cost a betterment? how should the saw be recorded after the repair?. issue. In July, one of our saws broke down which cost Modern Inc repair and maintenance of $11,500 but the repair...
-
Effective financial statement analysis requires an understanding of a firms economic characteristics. The relations between various financial statement items provide evidence of many of these...
-
The marketing department of Sunland and Company has developed a strategy to increase sales. For every $100 of purchases made by a customer, the customer receives a $5 gift card with no expiration...
-
How do you use functional requirements for this chapter?
-
List five advantages of analysis pattern.
-
Using the division method, convert 8008 to binary.
-
Identify the EBT for the word deployment.
-
How does deployment pattern help understand the core of the problem?
-
Thermal Corporation has two producing department and two service departments labeled P1, P2, $1, and $2, respectively. Direct costs for each department and the proportion of services costs used by...
-
On average there are four traffic accidents in a city during one hour of rush-hour traffic. Use the Poisson distribution to calculate the probability that in one such hour there arc (a) No accidents...
-
Explain why, whereas it is not usually possible to measure a value for the active coupling constant responsible for a cross peak, it is sometimes possible to measure values of the passive coupling...
-
(a) Using EXCEL (or some other suitable program) set up a spreadsheet which computes the line frequencies and inten¬sities of both the AB and X parts of an ABX system for an arbitrary set of...
-
If there are two peaks in the spectrum, we can work out the effect of a pulse sequence by treating the two lines separately. There is a separate magnetization vector for each line. Suppose that a...
-
Some liabilities are reported at their maturity amount. In general, when should liabilities, prior to the maturity date, be reported at less than their maturity amount?
-
In evaluating a balance sheet, some creditors say the liability section is one of the most important sections. What are some reasons justifying this position?
-
Compute the present value of a \(\$ 10,000\), one-year note payable that specifies no interest, although \(10 \%\) would be a realistic rate. Is the present value less than, greater than, or equal to...

Study smarter with the SolutionInn App