

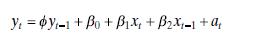
Consider the chemical process data in Table B.18. Fit the lagged variables regression models in Eqs. (14.26)
Question:
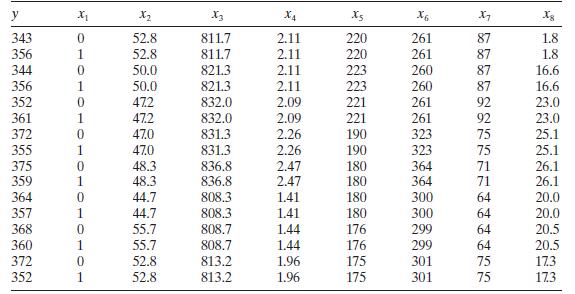
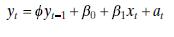
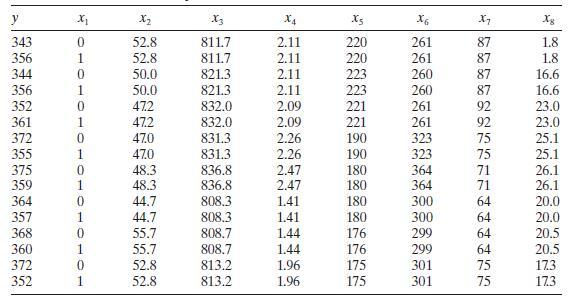
Consider the chemical process data in Table B.18. Fit the lagged variables regression models in Eqs. (14.26) and (14.27) to the yield response using temperature as the predictor. Compare these models to the results that you obtained in Exercise 14.2. Do the residuals from these models give any indication of remaining problems with autocorrelation?.
Equation (14.26)
Equation (14.27)
Data From Exercise 14.2
Table B. 18 contains hourly yield measurements from a chemical process and the process operating temperature. Fit a regression model to these data with the Cochrane-Orcutt method, using the temperature as the predictor. Analyze the residuals from this model. Is there evidence of autocorrelation in these data?
Step by Step Answer:


Introduction To Linear Regression Analysis
ISBN: 9781119578727
6th Edition
Authors: Douglas C. Montgomery, Elizabeth A. Peck, G. Geoffrey Vining
