

A histogram of the n = 345 grade point averages reported by students in the Student Survey
Question:
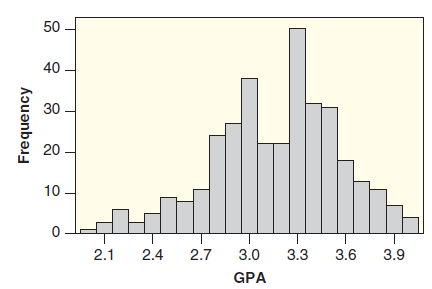
(a) Estimate and interpret the 10th percentile and the 75th percentile.
(b) Estimate the range.
Fantastic news! We've Found the answer you've been seeking!
Step by Step Answer:
a The 10 th percentile is the value with 10 of the area of the histogram to the left of it T...View the full answer

Answered By
OTIENO OBADO
I have a vast experience in teaching, mentoring and tutoring. I handle student concerns diligently and my academic background is undeniably aesthetic
3+ Reviews
10+ Question Solved
Related Book For 

Statistics Unlocking The Power Of Data
ISBN: 9780470601877
1st Edition
Authors: Robin H. Lock, Patti Frazer Lock, Kari Lock Morgan, Eric F. Lock, Dennis F. Lock
Question Posted:
